Vaya Display / Features
Everyday control.
A deeper understanding.
The essentials on a dedicated touchscreen. The bigger picture in your browser. Both included with your display.
One screen for your household
Your heating.
Easy to see.
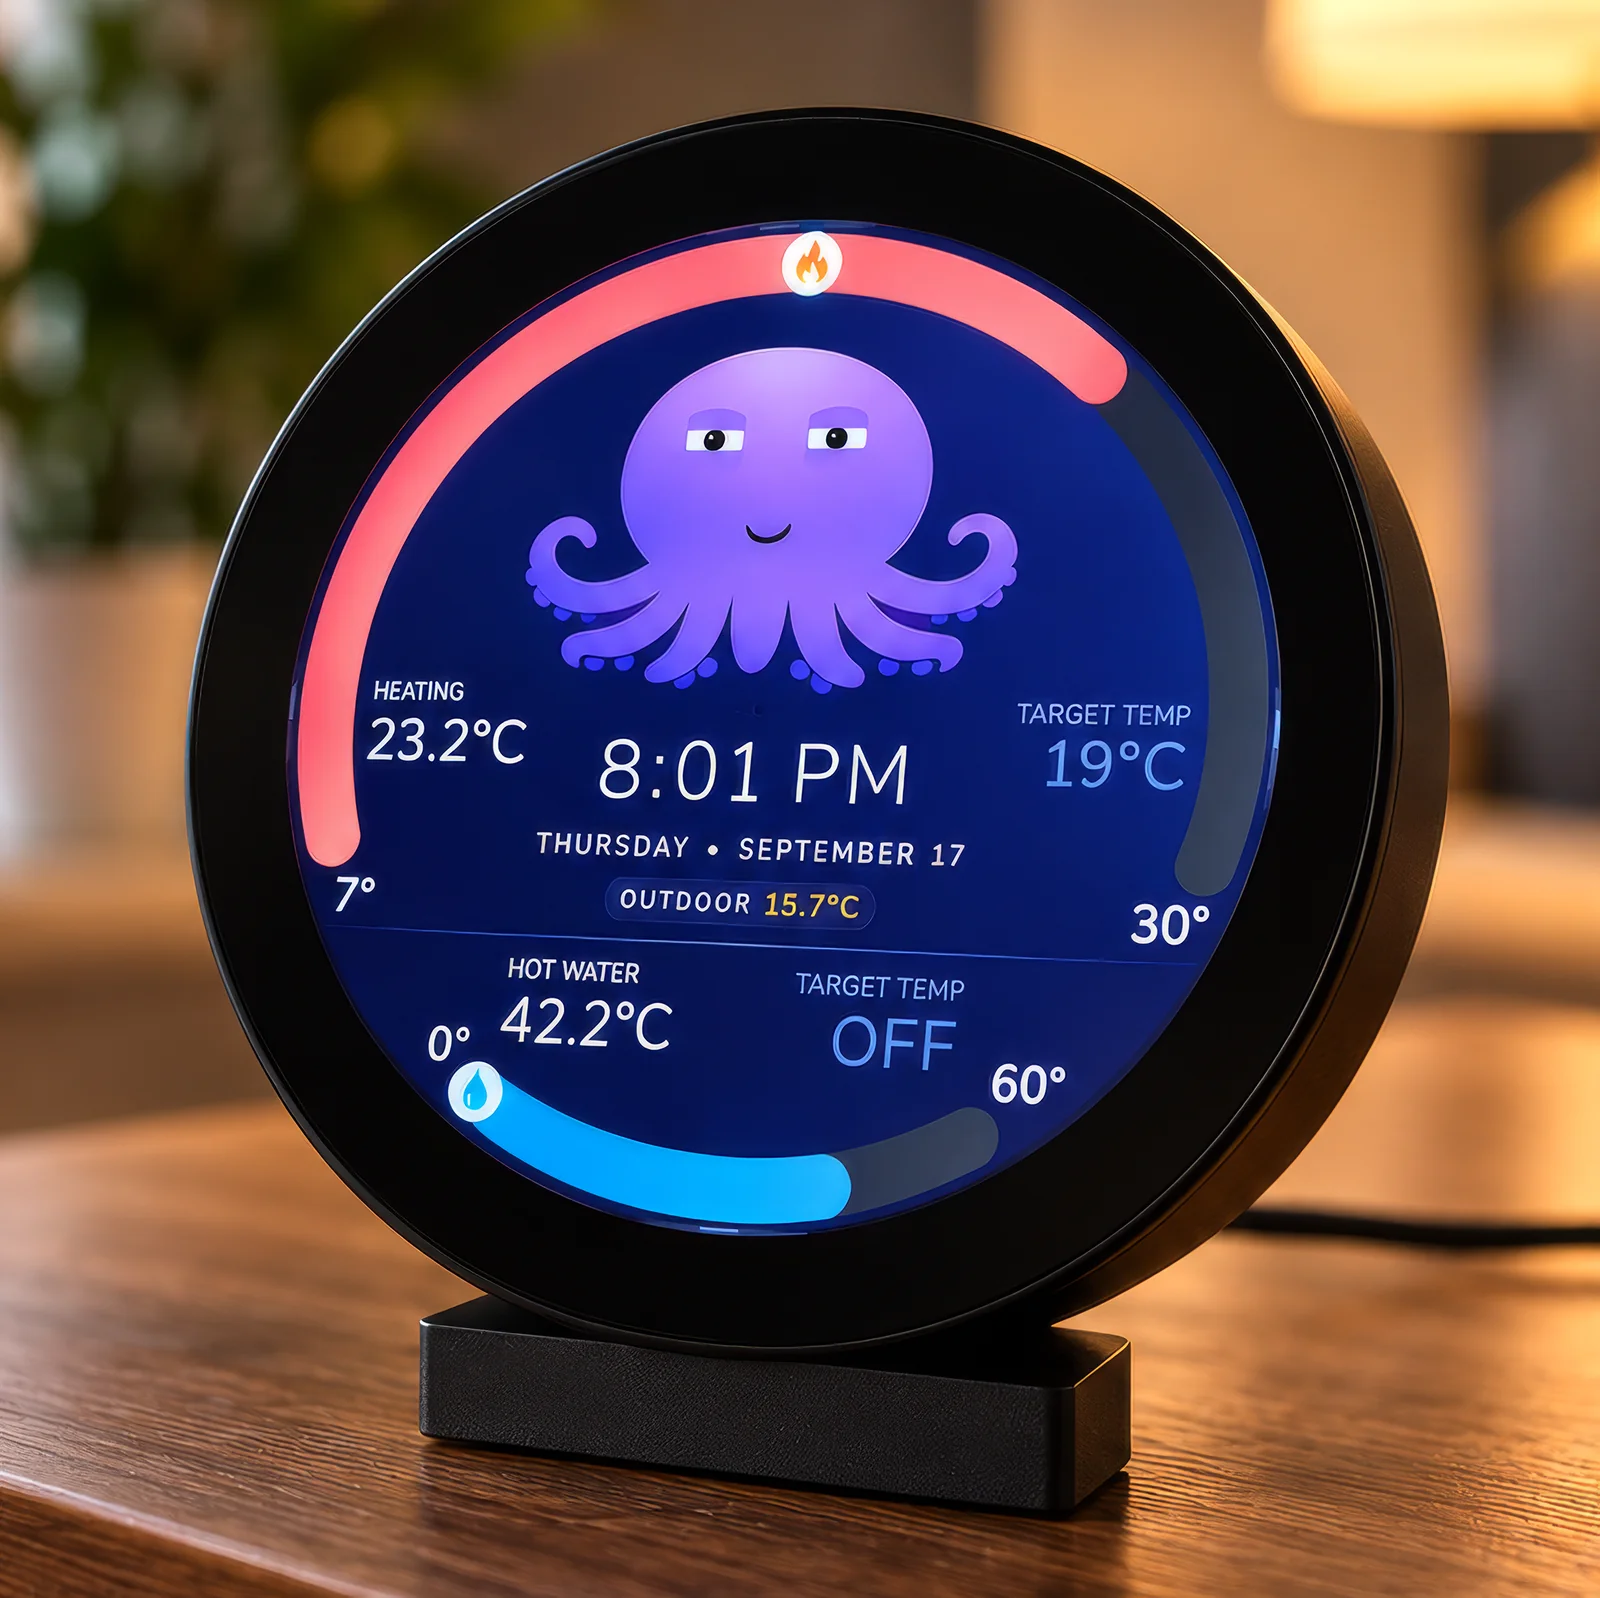
See the temperature and the target. Check your hot water. Start a boost. The things you look for most are right in front of you.
Everyday essentials / 01
The whole picture. One look.
See room temperatures, heating targets and hot water together. A dedicated screen keeps the essentials visible for everyone at home.
- Current temperatures and target setpoints
- Heating and hot water status
- Single- and dual-zone layouts
Everyday essentials / 02
A boost, without the phone.
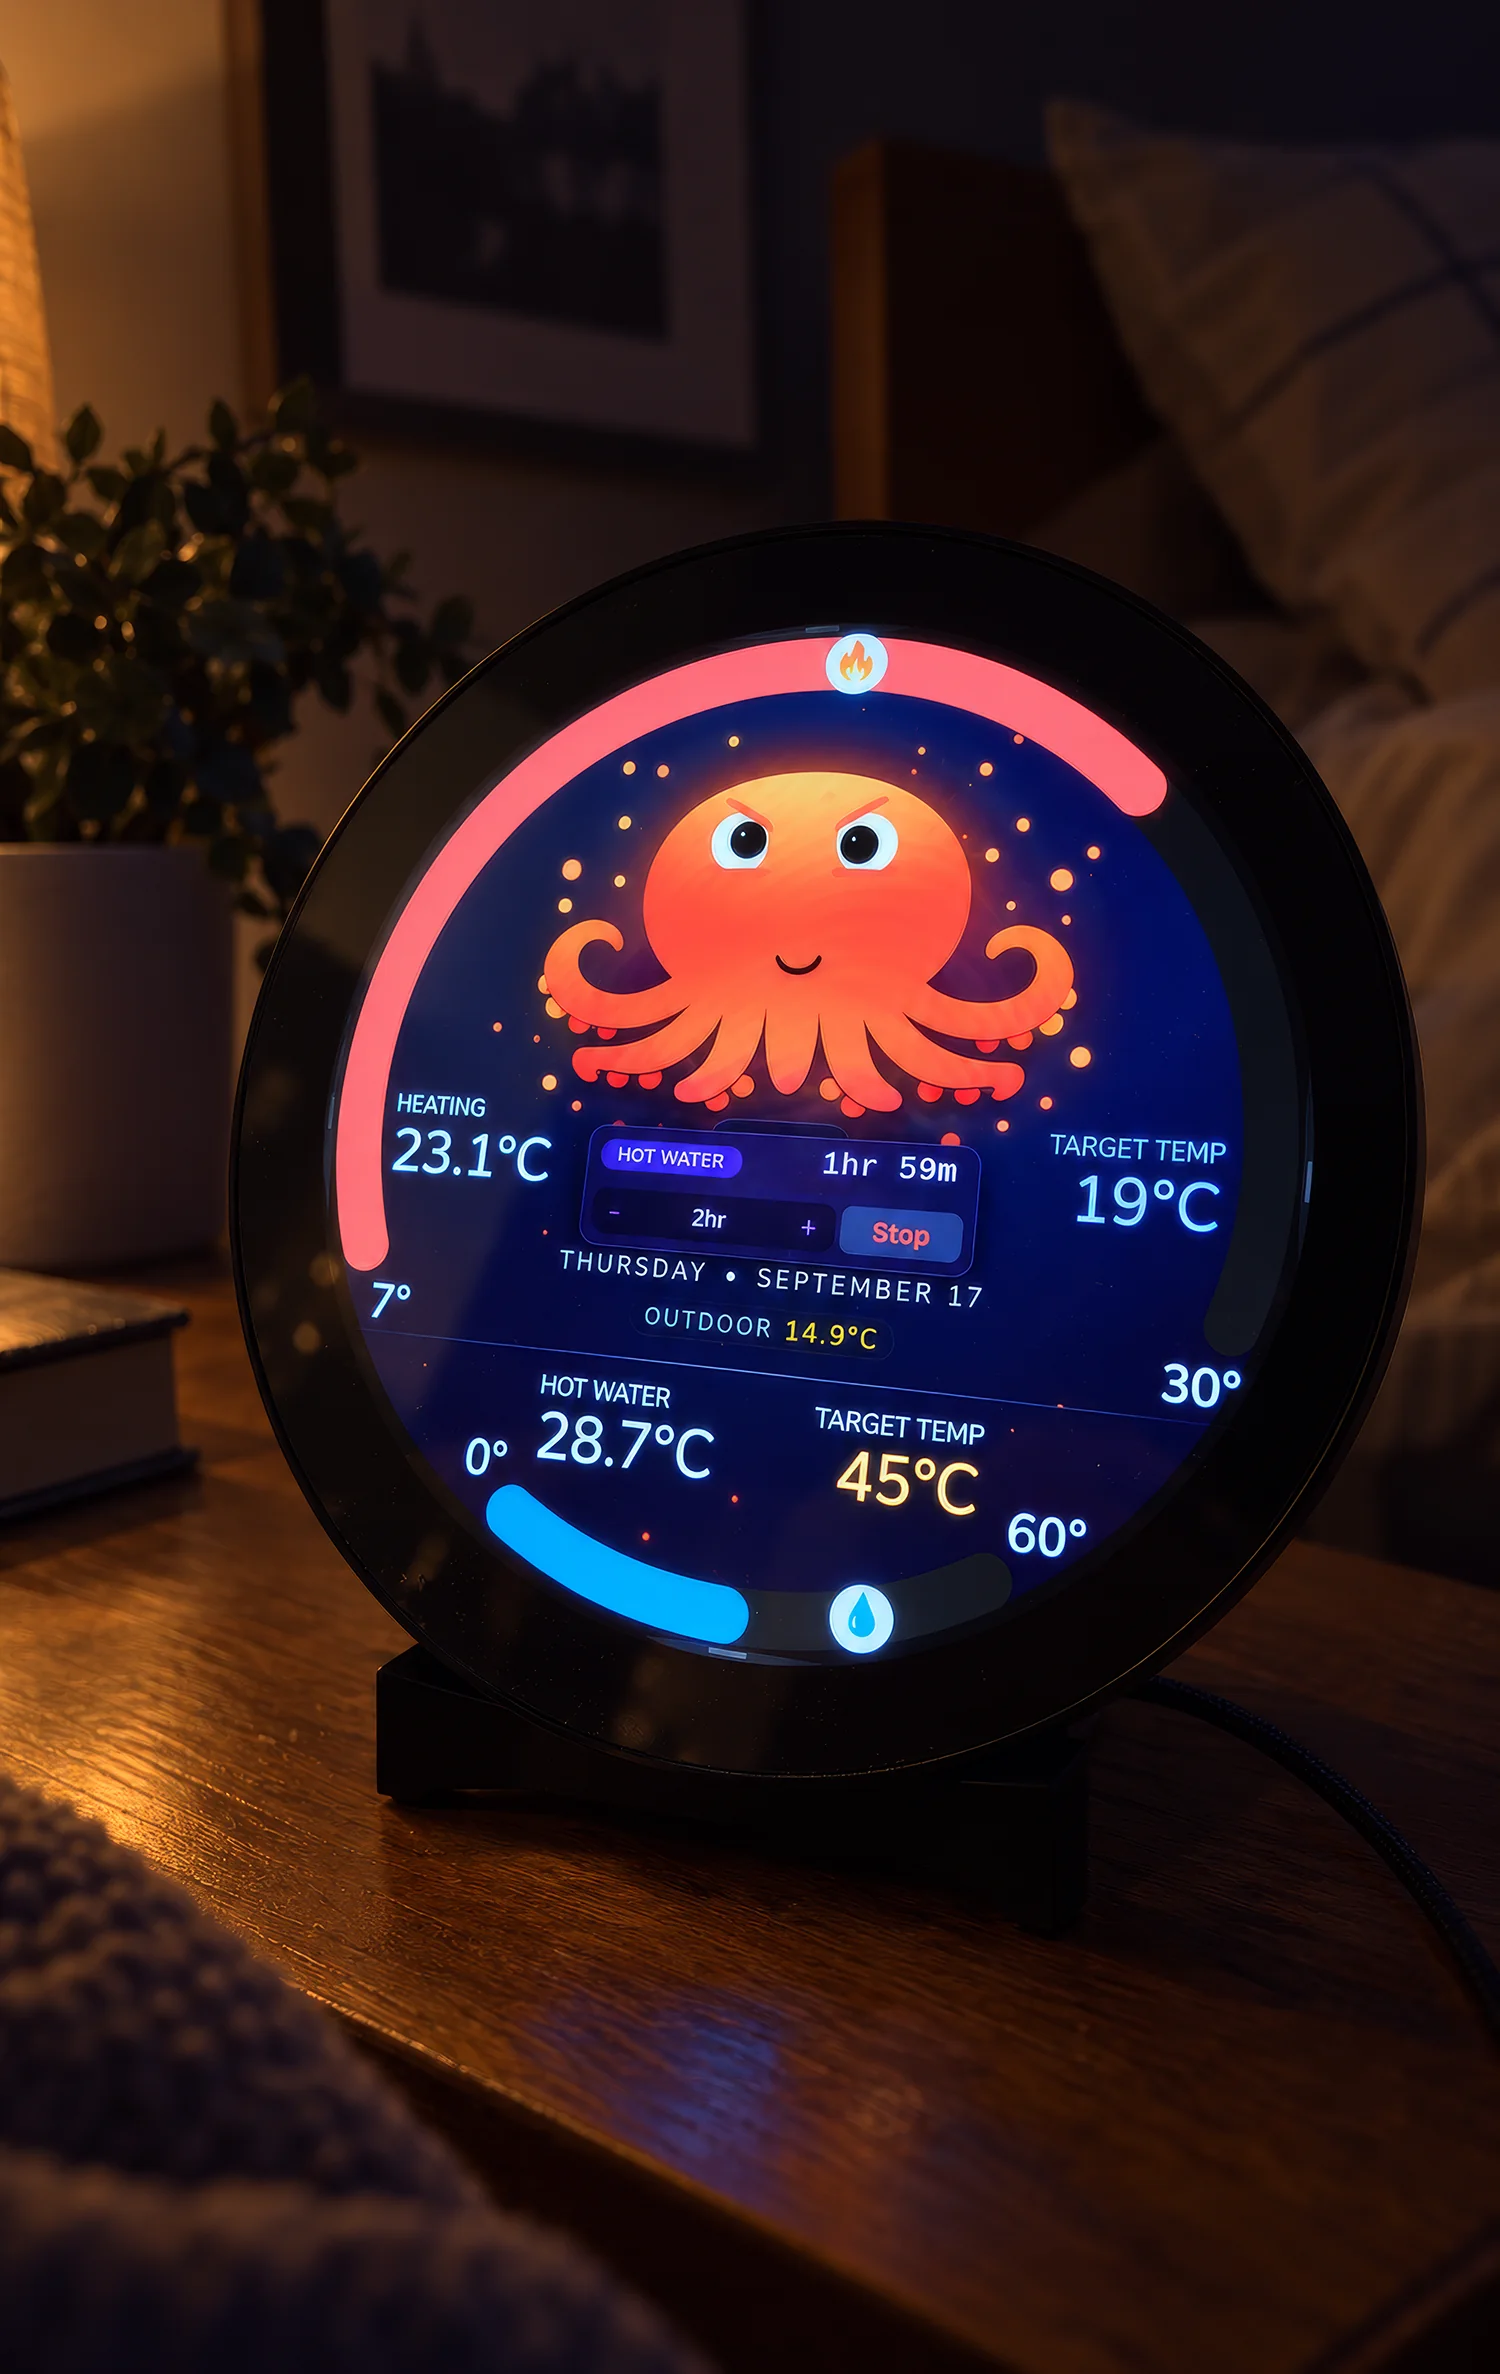
Start a heating or hot water boost from the touchscreen. See the time remaining, or stop it early without changing your regular schedule.
- Independent boost controls for your zones
- Hot water boost where supported by your system
- A clear countdown while boost is active
Everyday essentials / 03
A clearer view of your system.
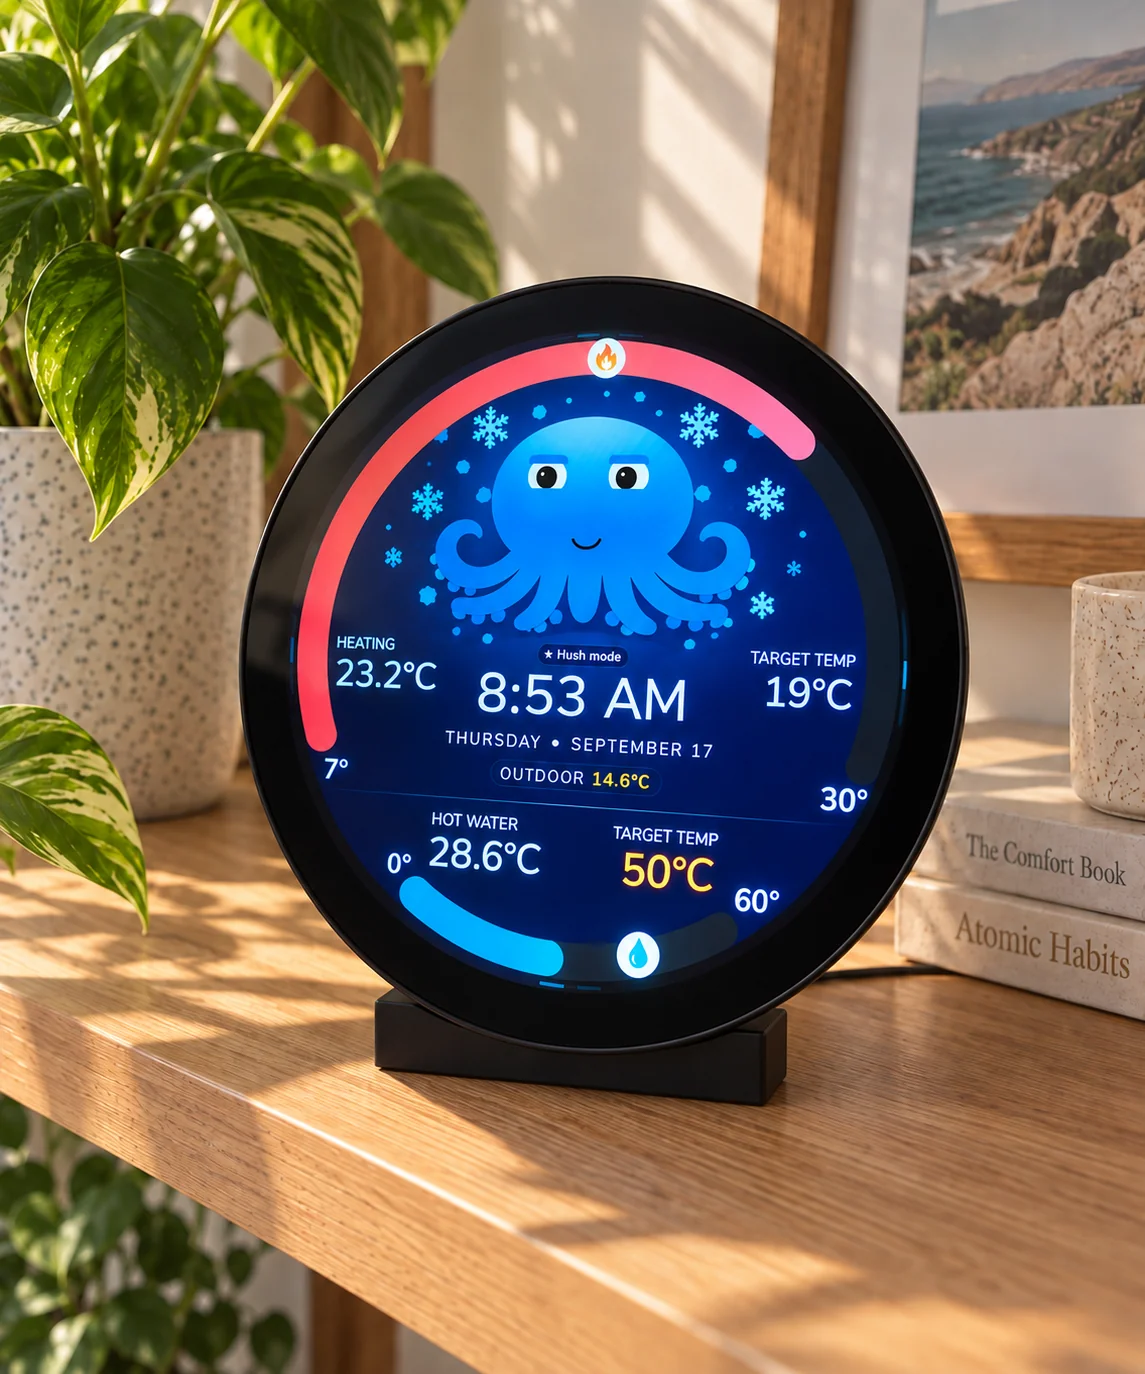
Recognise when your heat pump is heating, standing by or defrosting. Reported faults are surfaced too, so important information is not hidden in an app.
- Distinct heating, idle and defrost states
- Fault information when reported by the system
- Outdoor temperature alongside your home readings
Your routine, on your terms
A schedule that
fits your day.
View and edit heating and hot water schedules directly on the touchscreen. Change times and target temperatures, add entries, or copy a day without reaching for the app.
Schedule changes sync back to your Octopus account. For a temporary change, use boost and keep your usual routine intact.
See the controls in action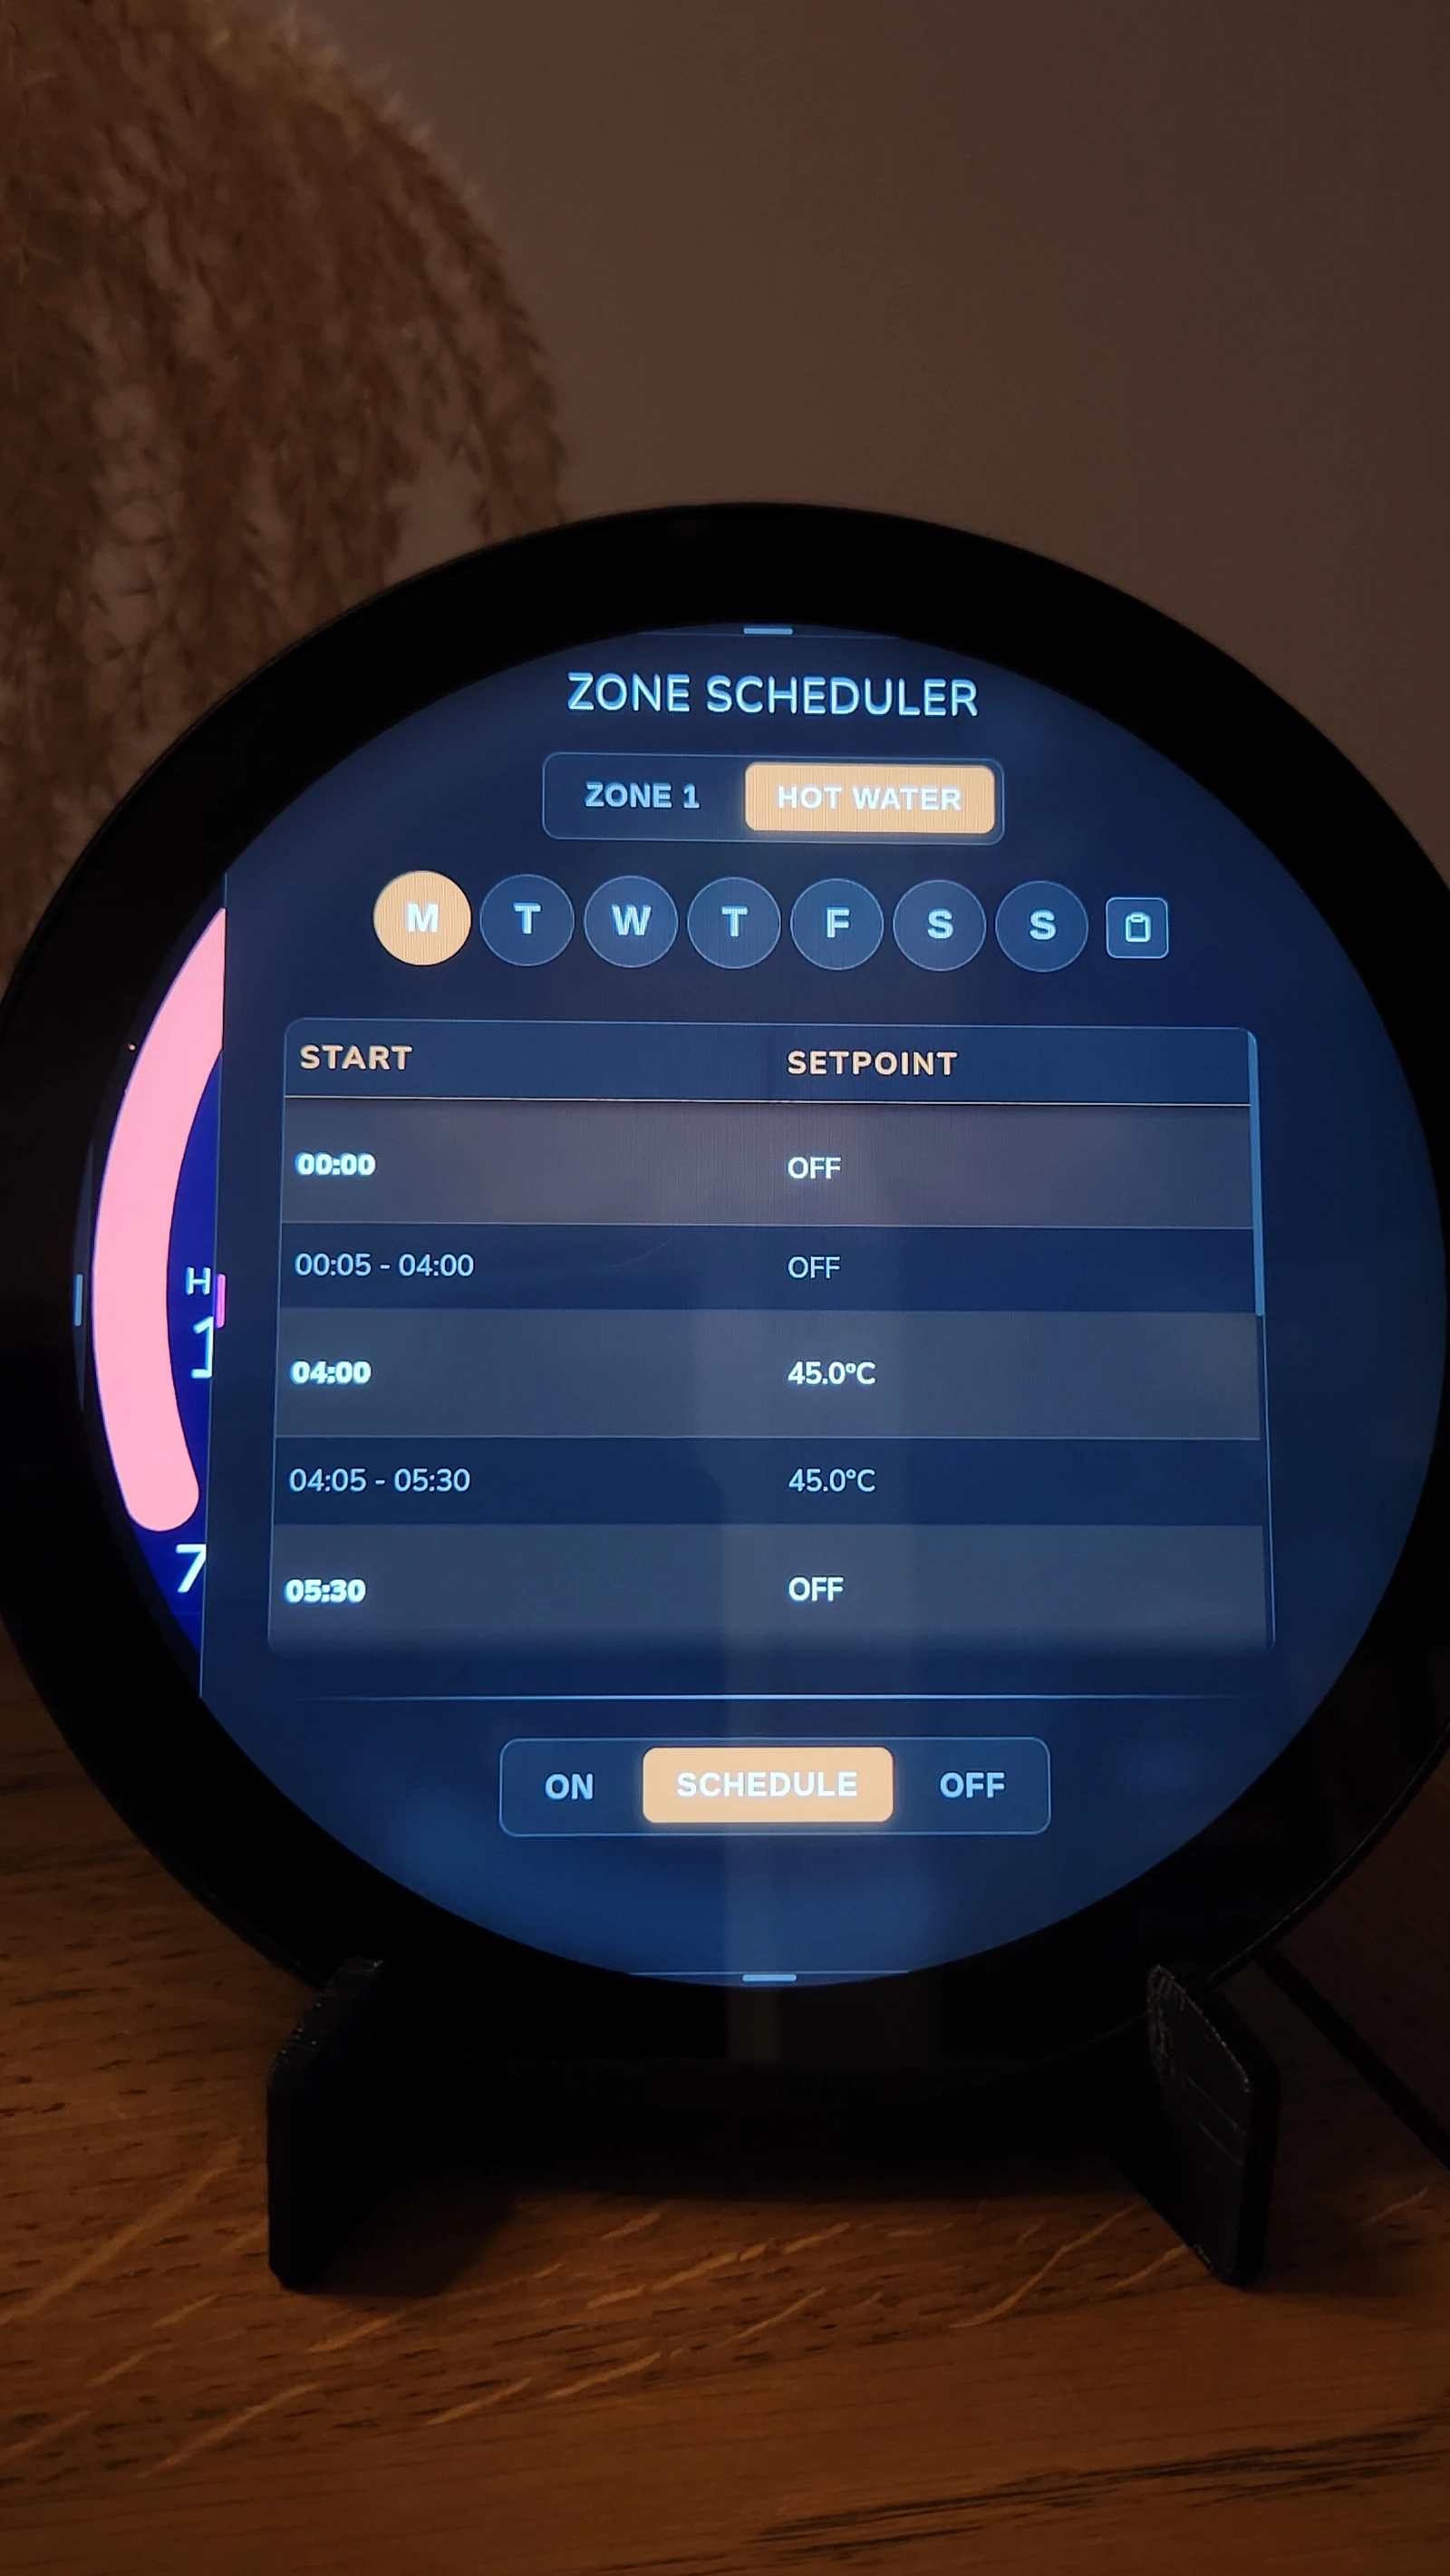
A closer look
More than
the temperature.
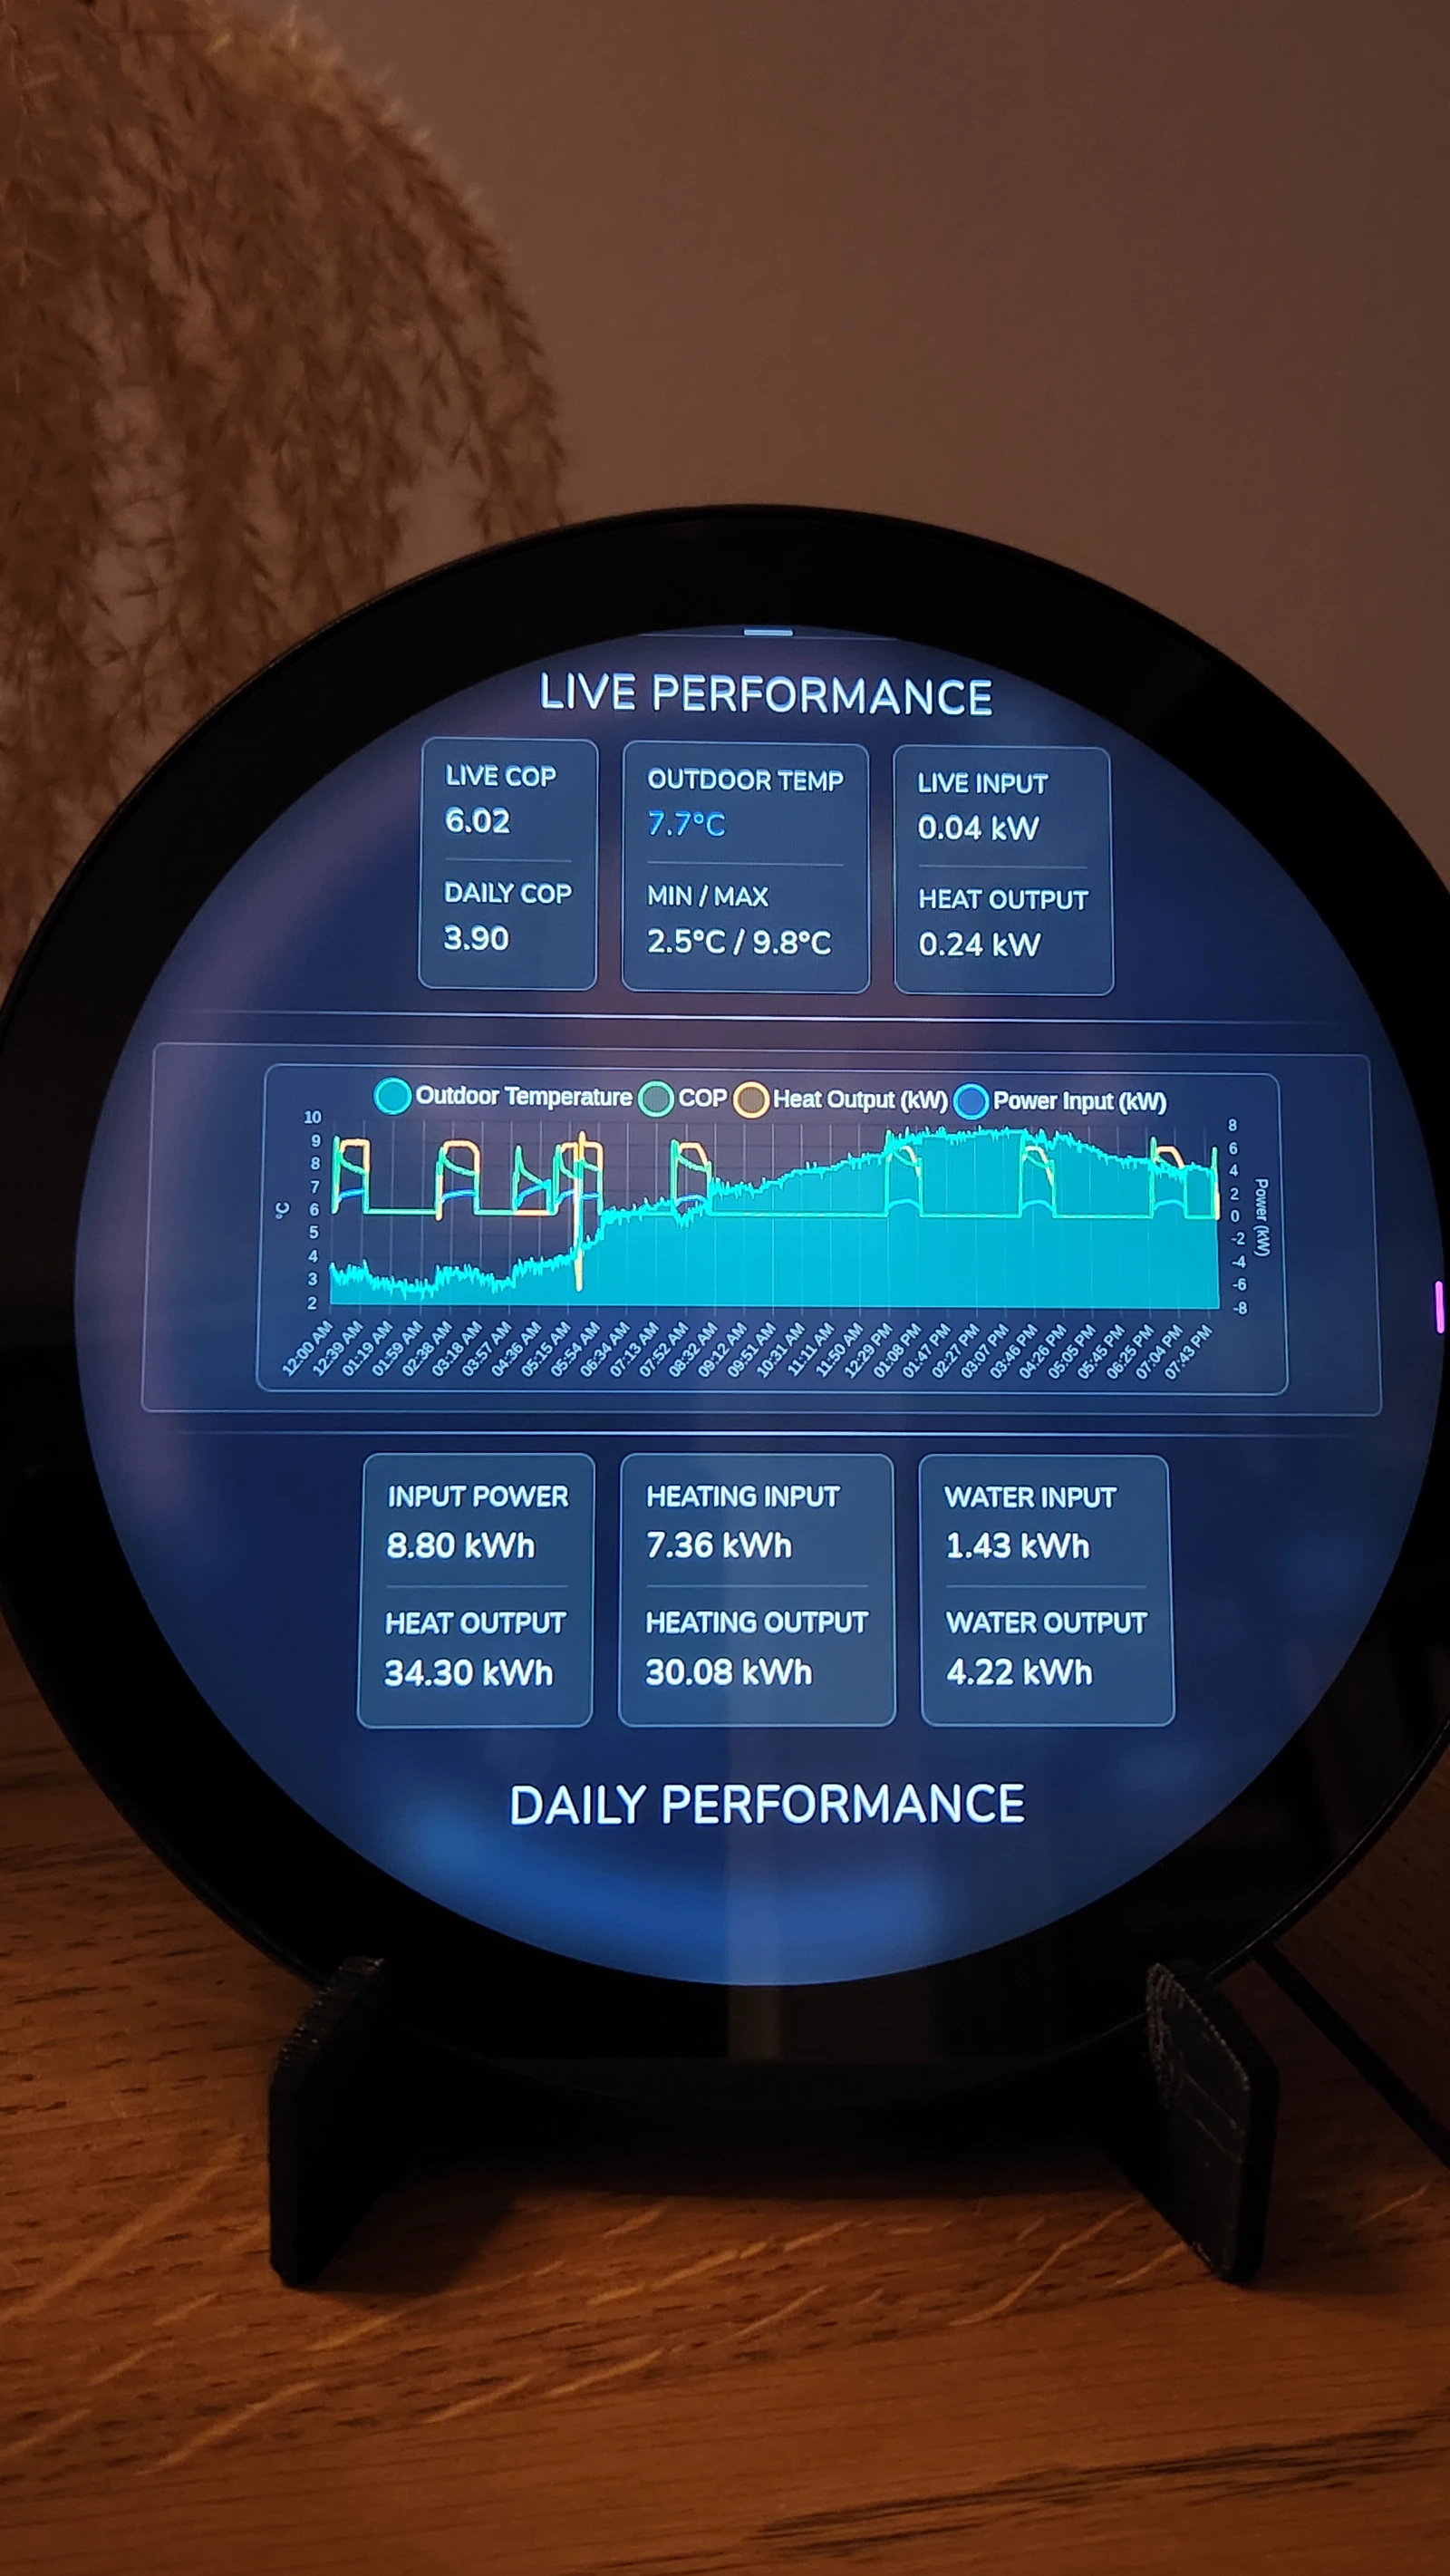
The performance panel brings together live COP, electrical input, heat output and daily charts. It gives you context for what your heat pump is doing.
COP is the ratio of heat delivered to electricity used. For example, a COP of 3 means three units of heat for each unit of electricity. It is a reading, not a promised level of efficiency.
Flow and return temperatures need optional additional sensors. They are not available from a standard installation through the API.
Included. No subscription.
Your heating.
With a little perspective.
The Metrics Dashboard runs on your display. Open it in a browser on your home network to see how performance changes over days, months and heating seasons.
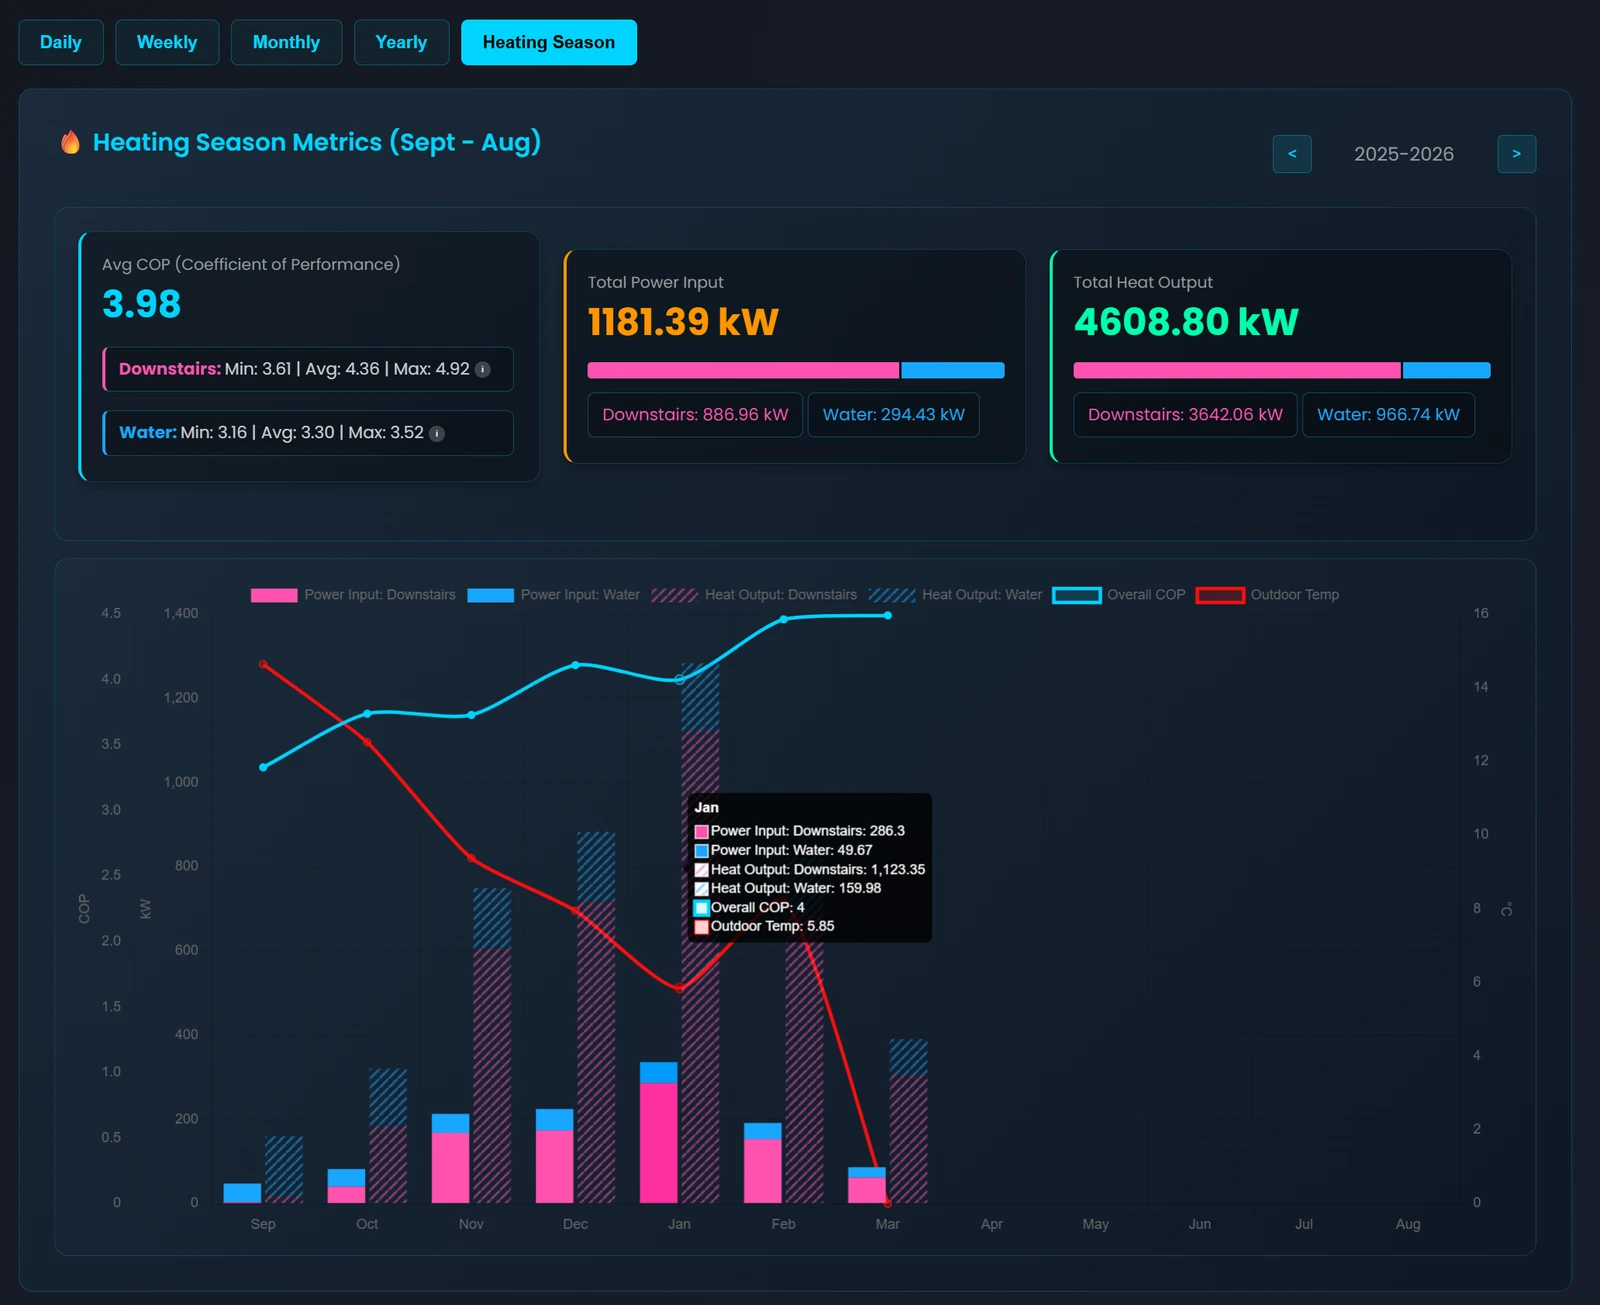
Energy use across a heating season
Follow heating and hot water usage alongside COP. Switch between daily, weekly, monthly, yearly and heating-season views.
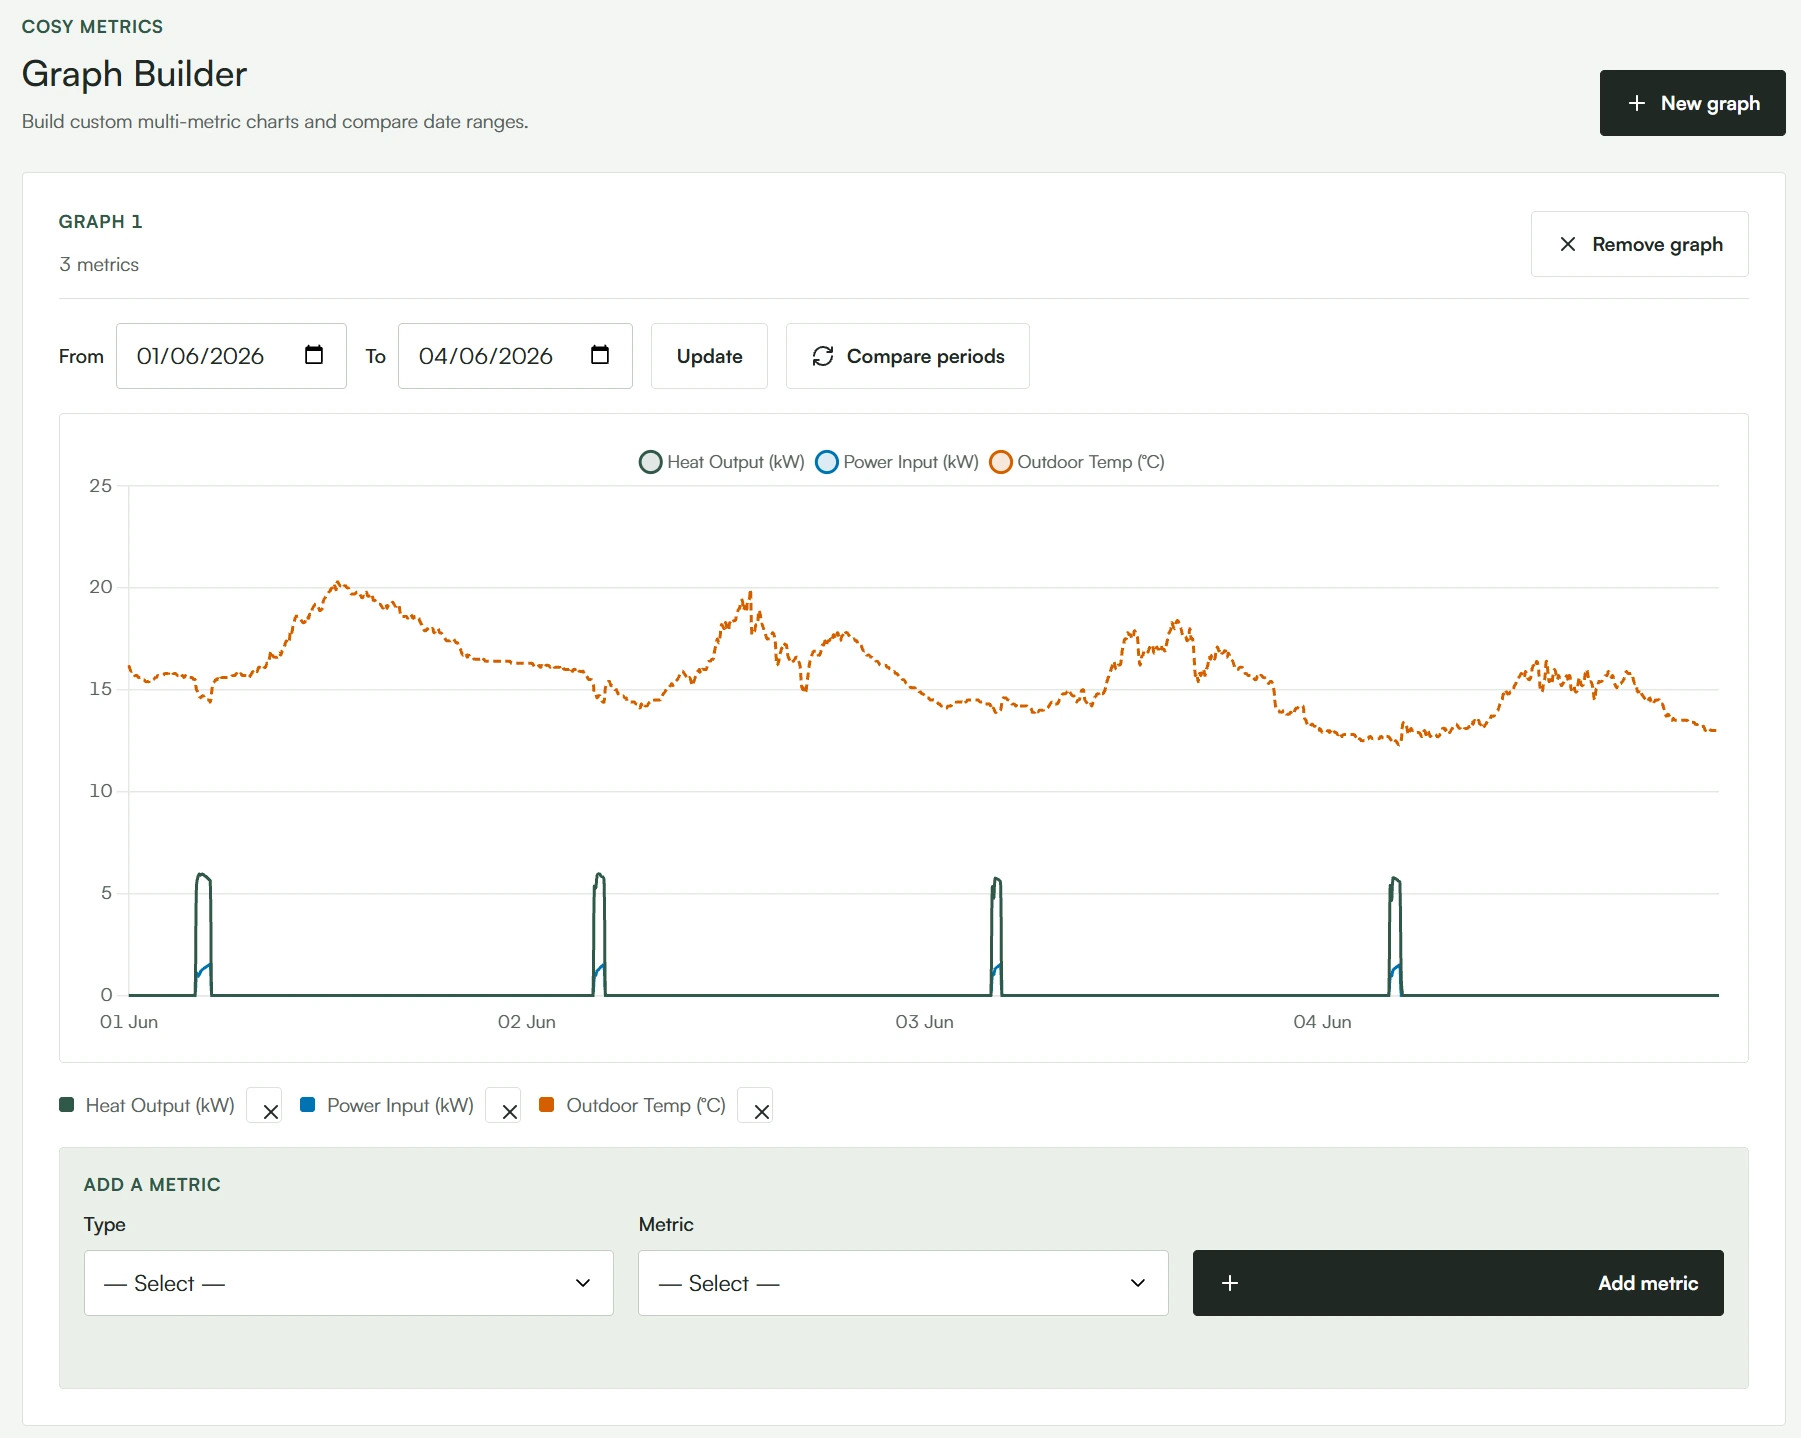
Compare your readings over time
Choose metrics and date ranges to build your own charts. Optional flow and return readings are available when additional sensors are installed.
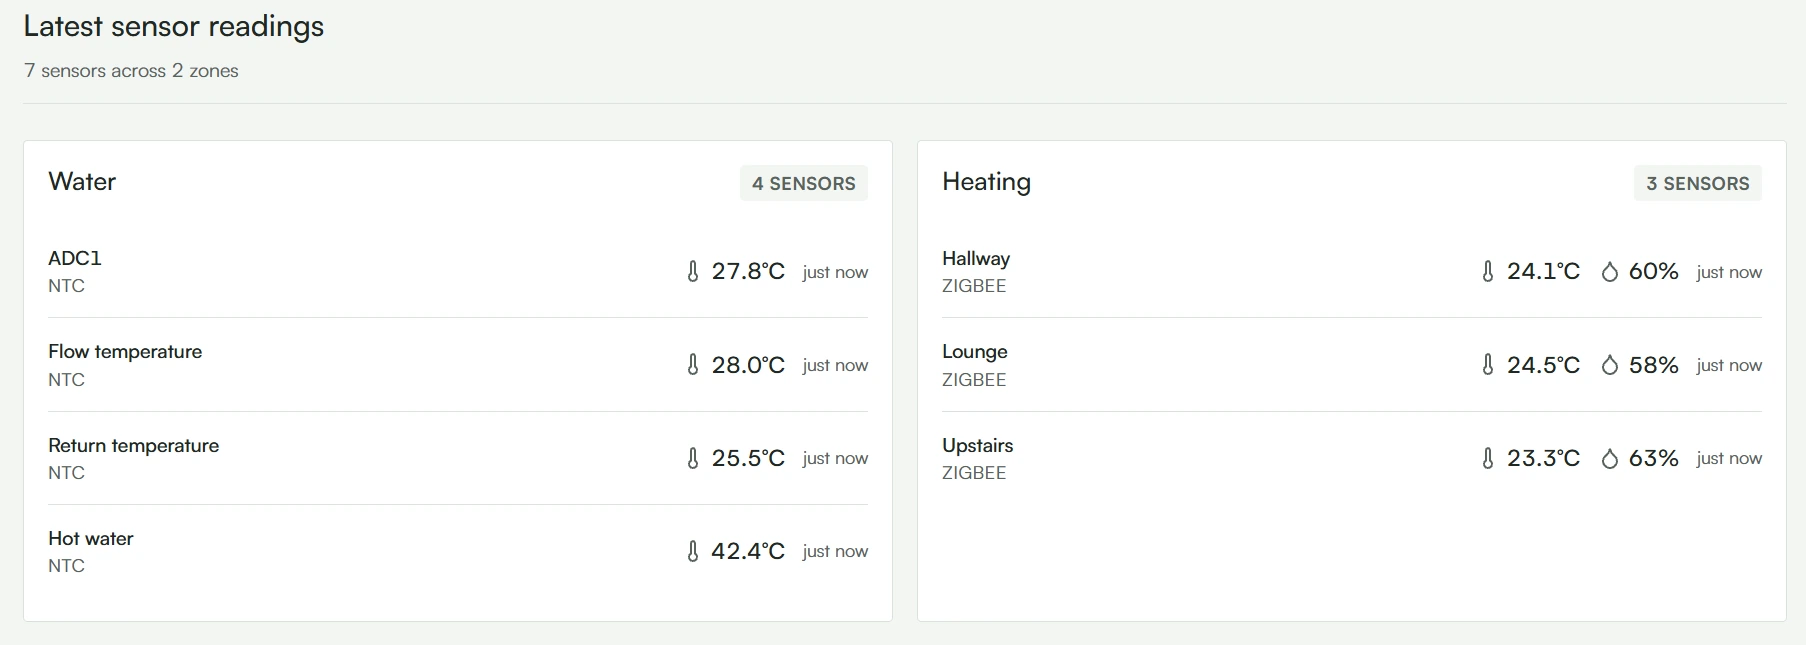
A room-by-room view
See the readings from your connected Cosy Pods, with temperatures and humidity grouped by sensor and zone.
Patterns & events
Review defrost events, recorded faults, Hush Mode performance and longer-term insights.
Keep exploring
Export your readings as CSV files for spreadsheets and your own analysis.
Local history
Data builds from setup onwards and is stored on the display. Live updates need internet access.
Example screenshots, not predicted results. Available readings depend on your system, sensors and the Octopus Energy API. The dashboard is accessible on your home network, not a remote cloud service.
Read the Metrics Dashboard guideOn the actual display
See it working.
A closer look at the touch controls, recorded on the device.
Start a zone boost
Choose a boost duration, confirm, then see the countdown on the home screen.
Edit a schedule
Adjust an entry on the touchscreen and return to your schedule.
Open the performance panel
Swipe into performance readings and back to the main screen.
One display. All included.
£260 plus UK postage. A stand, wall mount, power adapter, Metrics Dashboard and setup support.