Make yourself at home.
Set up your display, find your way around and make the most of your heating information.
A few things before you start
From the box to live readings.
Setup typically takes around 5–10 minutes. Have your 2.4 GHz Wi-Fi password, Octopus account number and Developer API key ready.
Plug in your display
Place it on the included desk stand, or follow the wall-mounting guide. Connect the supplied USB-C power adapter and switch on at the mains.
Connect to Wi-Fi
Choose your home network, enter its password and tap Connect to WiFi! When connected, tap Continue setup. Use a 2.4 GHz network, not a 5 GHz-only network.
Link your Cosy system
Enter your Octopus Developer API key and account number. The guide discovers your heat pump, then lets you name your zones, choose your sensors and set display preferences.
What happens next?
Your display shows temperatures and targets, heating status, hot water and performance information. Your existing Cosy system and app continue to work alongside it.
Explore the touchscreen controls or open your Metrics Dashboard.
Step by step
Setup & mounting.
1. Power on
Connect the supplied USB-C adapter to the port on the back of the display. If the adapter has a separate cable, connect the cable to the adapter first. Plug into a mains socket and switch on. The display boots automatically.
2. Wall mounting, if you prefer
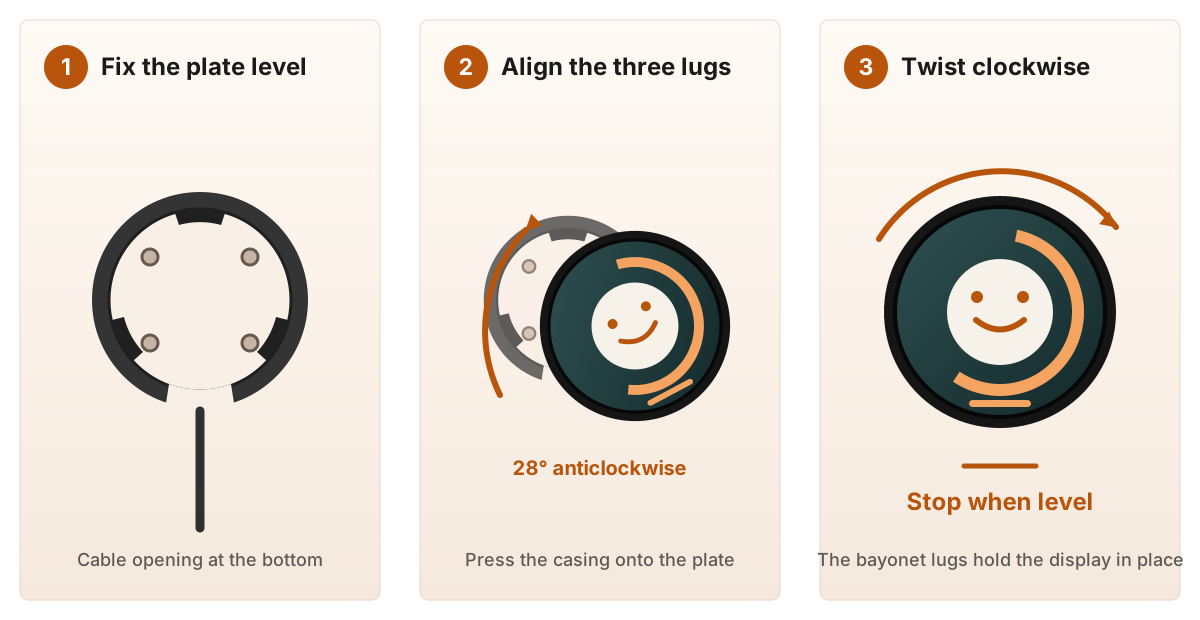
The twist-lock mounting plate fixes to your wall. Three lugs on the display engage with the plate using a short clockwise turn. Choose screws and wall plugs suitable for your wall.
- Turn the mounting plate anticlockwise relative to the display and lift it away when the lugs reach the entry slots.
- Hold the plate level with the cable opening at the bottom. Use it to mark the four mounting holes.
- Fix the plate using suitable screws and wall plugs. Keep screw heads flush so they cannot foul the casing.
- For hidden wiring, bring the USB-C cable through the centre of the plate. For surface wiring, route it through the opening at the bottom.
- Hold the display about 28 degrees anticlockwise from level. Align its three lugs with the entry slots and press it against the plate.
- Rotate clockwise until the display reaches the stops and sits level. Do not force it past the stops.
3. Connect to Wi-Fi
- Choose your network on the Wi-Fi Configuration screen. If it is missing or hidden, enter its SSID manually.
- Enter the password. Use Show to check it, then tap Connect to WiFi!
- After connecting, tap Continue setup.
4. Link your Octopus account
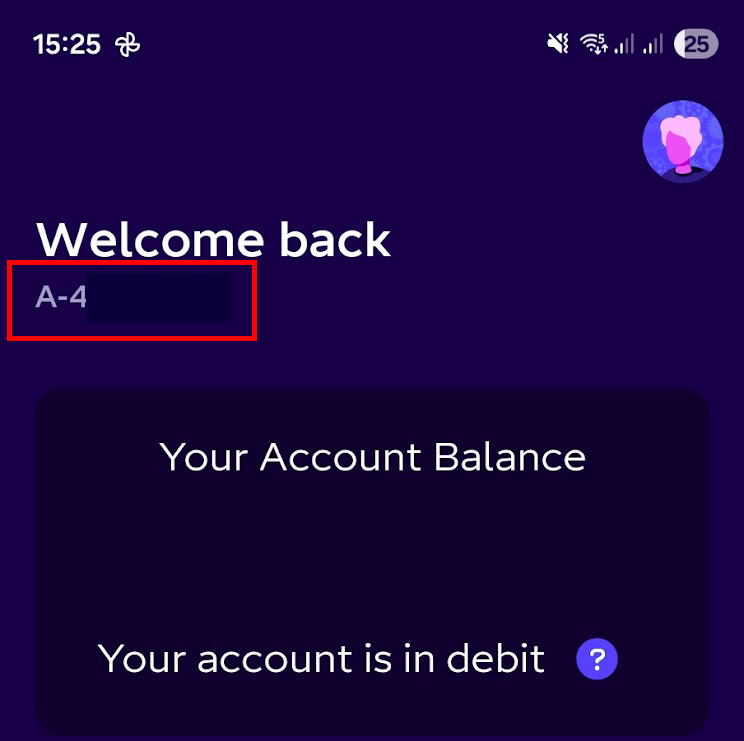
Create or find your API key in Octopus Developer settings. Your account number is shown in the Octopus app or dashboard and starts with A-. Octopus also provides an API access guide.
- Enter the API key on the display and tap Authenticate.
- Enter your account number and tap Find heat pump.
- If several heat pumps appear, select the one this display should use.
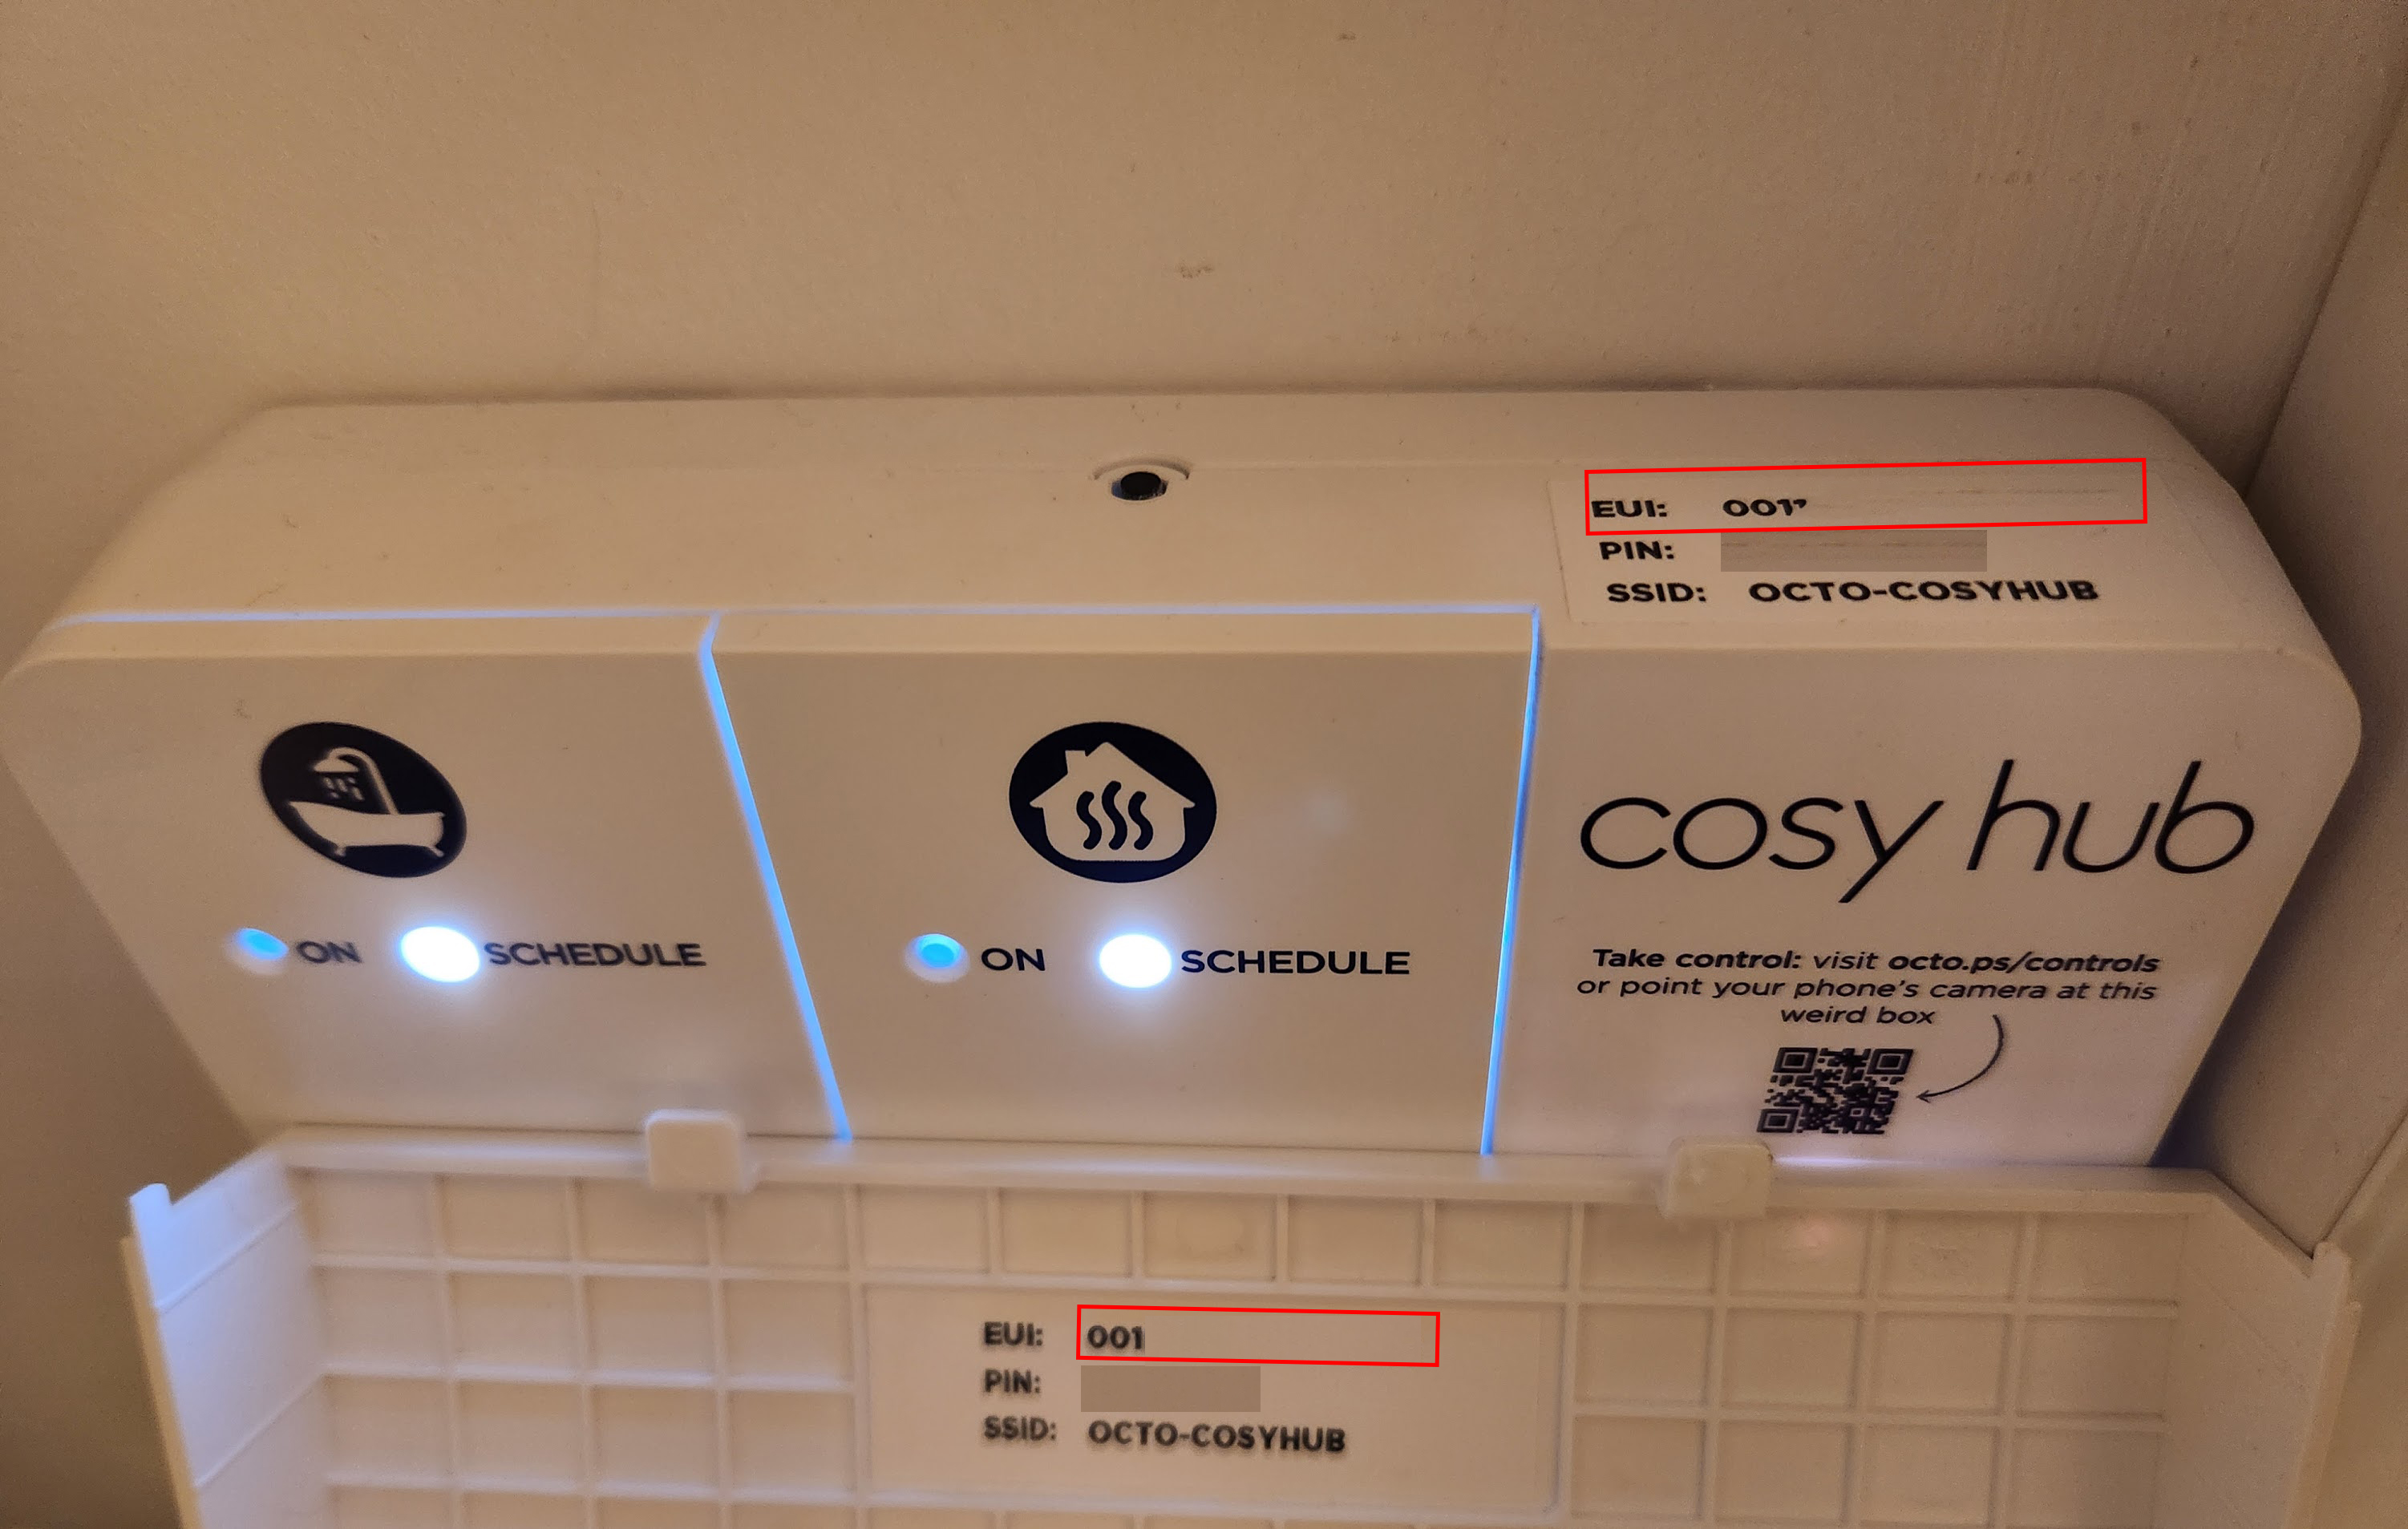
- If automatic discovery fails, use the manual option and enter the EUID on the Cosy Hub label.
5. Name your zones
The display detects a single- or dual-zone setup. Name your heating zone, or name both zones in a dual-zone home. Tap Next. Both zones have independent readings and boost controls.
6. Choose your sensors
Pick the Cosy Pod you want as the primary temperature reading for each zone. Select the hot water sensor for your cylinder where present. Sensor names and current values help identify them. You can change these choices later in Preferences.
7. Optional flow and return readings
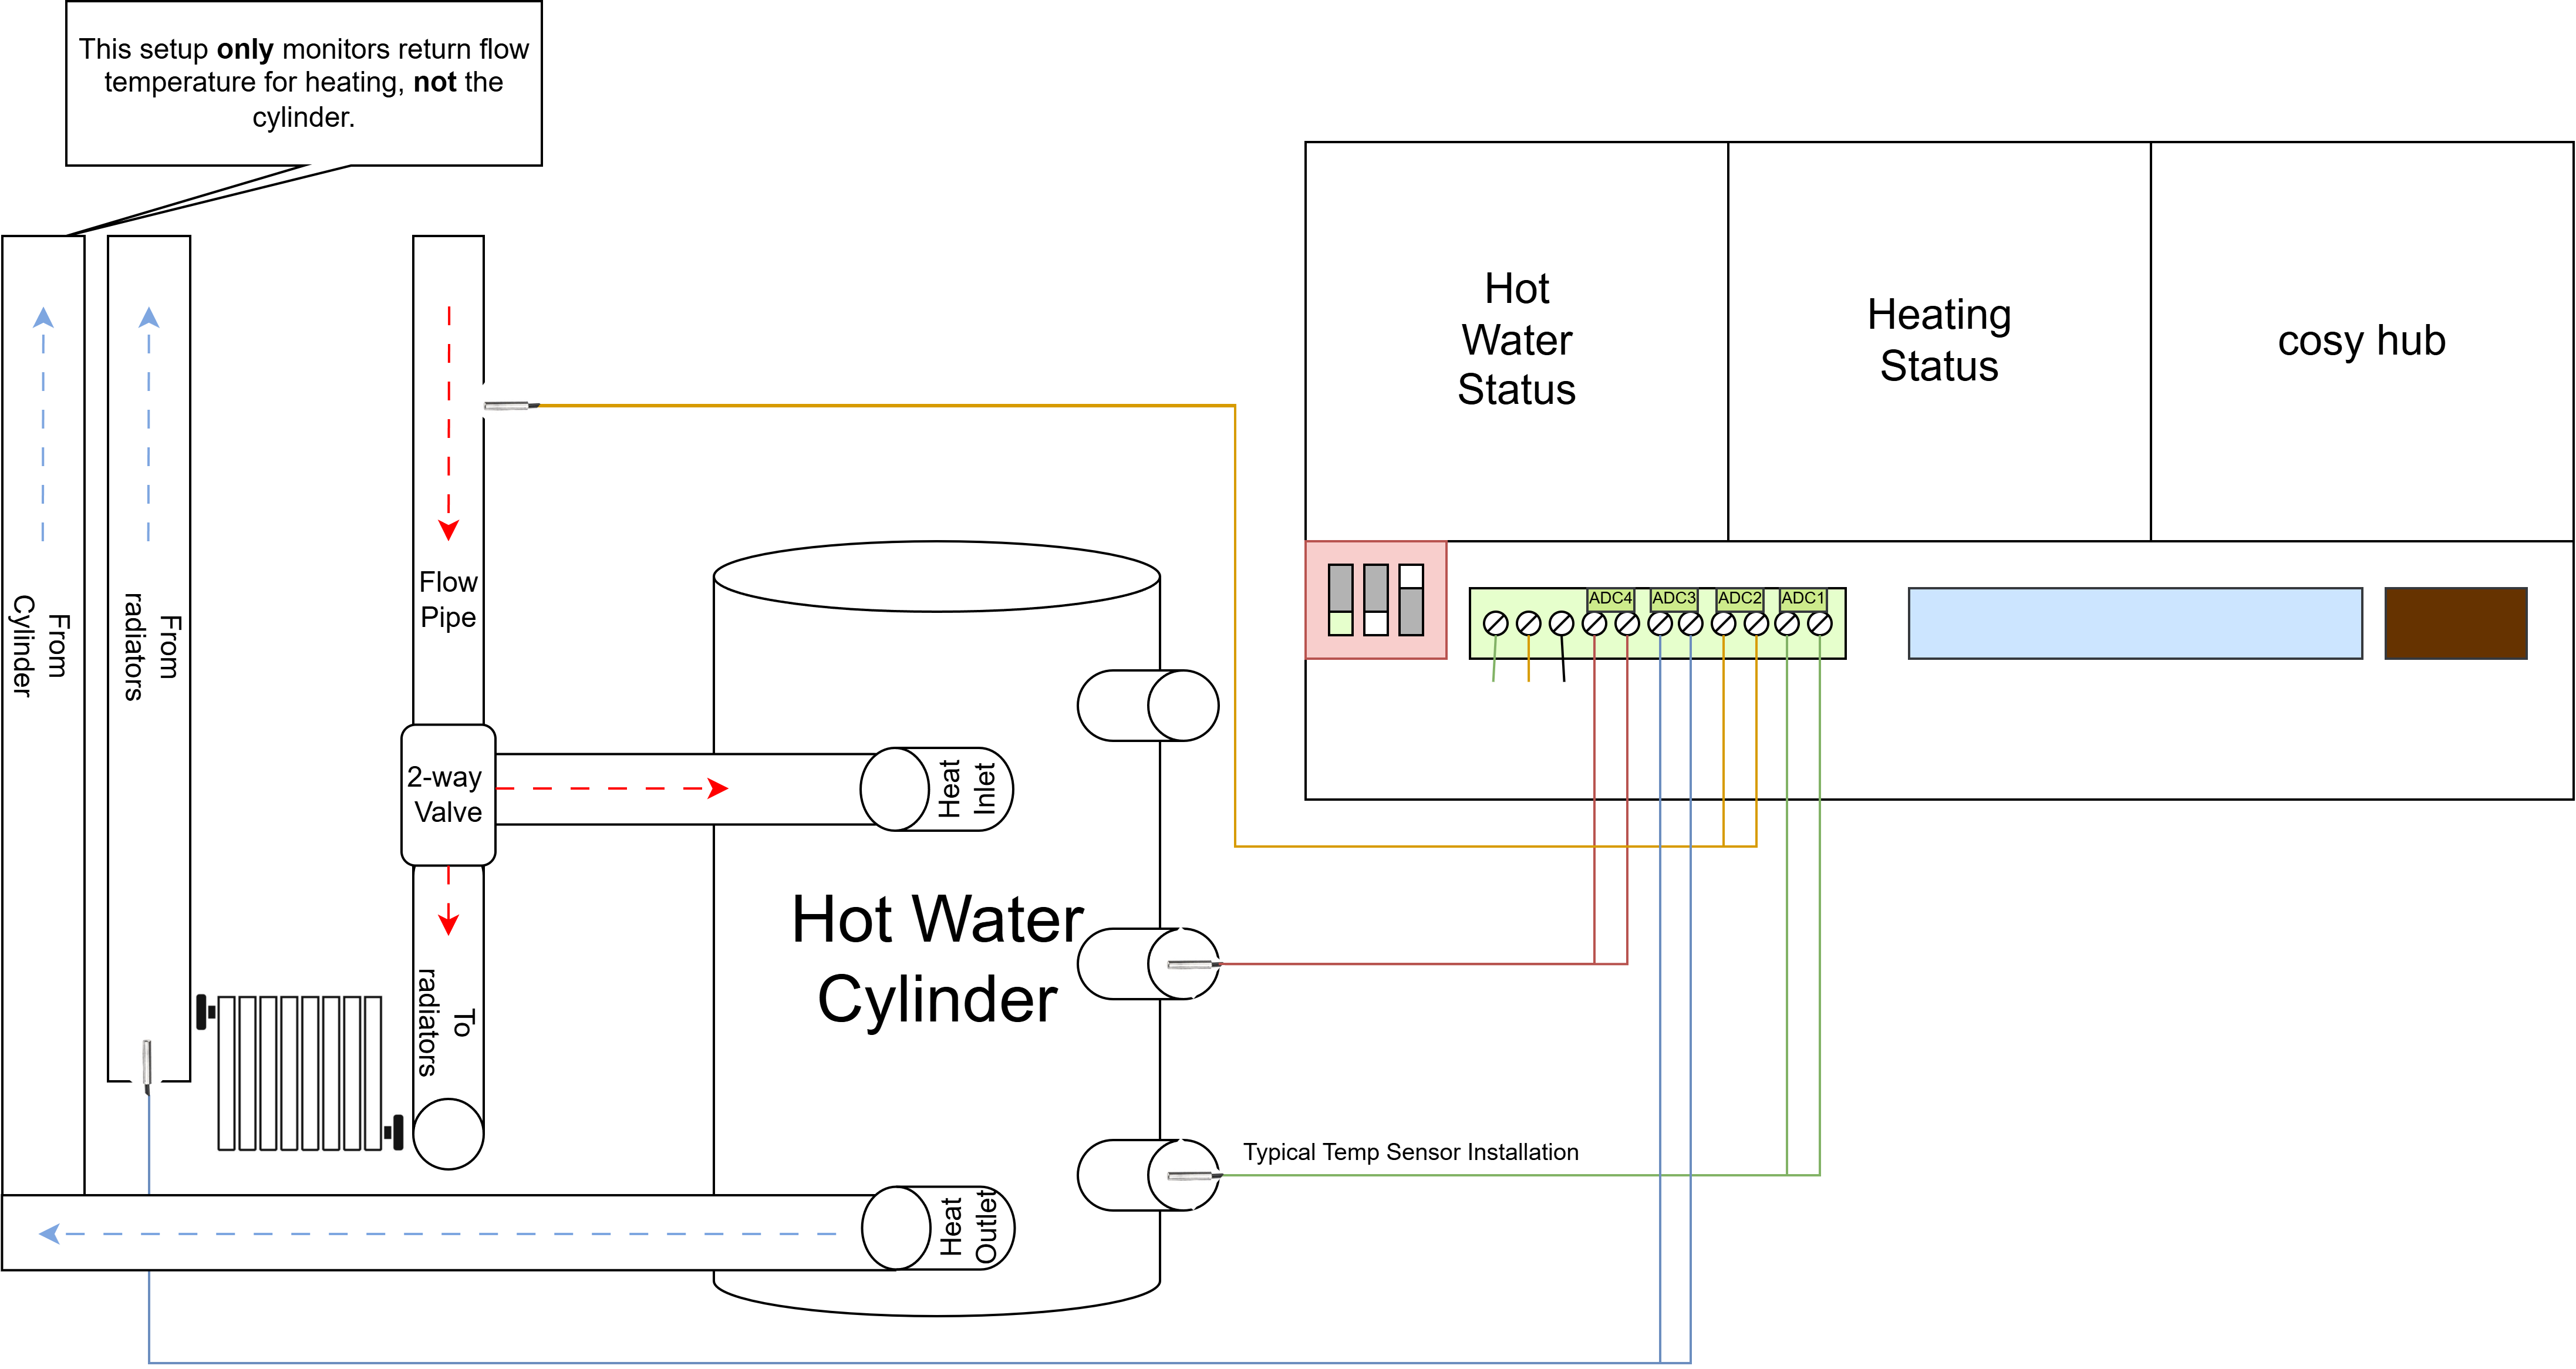
If you have additional pipe sensors connected to the Cosy Hub, enable Flow Readings and assign different sensors to flow and return. Otherwise, leave it off and continue. This does not affect normal display features.
Read the optional sensor guidance.
8. Set your preferences
- Automatic updates: enable to receive available software updates.
- Clock: choose 12- or 24-hour format and whether it appears on the screensaver.
- Screensaver: enable or disable it and choose an idle delay from 1–30 minutes.
Complete the guide to go live. To change preferences later, pull down the top settings drawer and tap Preferences.
Troubleshooting
My Wi-Fi network is missing or will not connect
Check that your router offers 2.4 GHz Wi-Fi. Refresh the network list or type the SSID manually, then check your password using Show. For intermittent connectivity, move closer to the router or improve Wi-Fi coverage.
Authentication or account discovery fails
Check the entire API key for missing characters or spaces. Check the account number, including the letter, dash and eight following characters. If discovery still fails, enter the EUID printed on the Cosy Hub.
Readings are blank, stale or show two dashes
Check Wi-Fi status in the top settings drawer. After initial setup, allow 1–2 minutes for the first data to arrive. Live readings require internet access to the Octopus API.
How do I restart or reset?
To restart, switch off or unplug the display, wait a few seconds, then reconnect power. Settings are preserved.
To factory reset, open the top settings drawer, choose Factory Reset and confirm. This clears Wi-Fi credentials, account details, zone names and sensor choices. Setup must then be completed again.
Everyday use
Get to know your display.
The main screen brings together current and target temperatures, heating status and hot water. It adapts to one or two zones. Faults reported by the heat pump are surfaced as alerts.
- Tap a zone
- Open boost controls. Choose a duration and confirm. A countdown appears while active; tap again to stop early.
- Swipe left
- Open the Schedule Panel to view, add, edit and copy heating or hot water entries. Changes sync to your Octopus account.
- Swipe right
- Open the Performance Panel for COP, electrical input, heat output and daily charts. Swipe left to close.
- Swipe up from the bottom
- Open the Cosy Status Panel for the heat pump's current operating state. Swipe down to close.
- Pull down from the top
- Open settings for brightness, Wi-Fi, preferences and factory reset.
- Tap the screensaver
- Return to the main screen. The screensaver can show time, temperatures, performance summaries and status.
Heating and hot water boosts
Boost each heating zone independently. If supported by your hot water configuration, tap the cylinder area to start or stop a hot water boost. Boost is temporary and does not change the regular schedule.
Performance readings
Live COP describes the ratio of heat output to electrical input. The panel also shows energy input, heat output and daily charts. Optional flow and return readings, and the temperature difference between them, appear when additional sensors are configured.
Brightness and quiet moments
Use the brightness slider in the settings drawer. Preferences control the screensaver delay, clock format, automatic updates, zone names and selected sensors.
Recorded demonstrations
Start a zone boost
Boost two zones independently
Open the Performance Panel
Edit a schedule entry
Copy schedule entries
Navigate the schedule
Included with your display
Your Metrics Dashboard.
The dashboard runs on your display. Use a browser on a phone, tablet or computer on the same home network. There is nothing extra to install.
Open the dashboard
- Pull down the display's settings drawer and open WiFi Configuration.
- Find the display's local IP address, for example 192.168.1.42.
- Enter that address in your browser on the same Wi-Fi network.
- Bookmark the address. If the router changes it later, check Wi-Fi Configuration again.
Find the information you need
- Overview
- Live performance and sensors, with daily, weekly, monthly, yearly and heating-season views.
- Insights
- COP statistics, runtime, best and worst days, hourly usage and COP versus outdoor temperature over a chosen range.
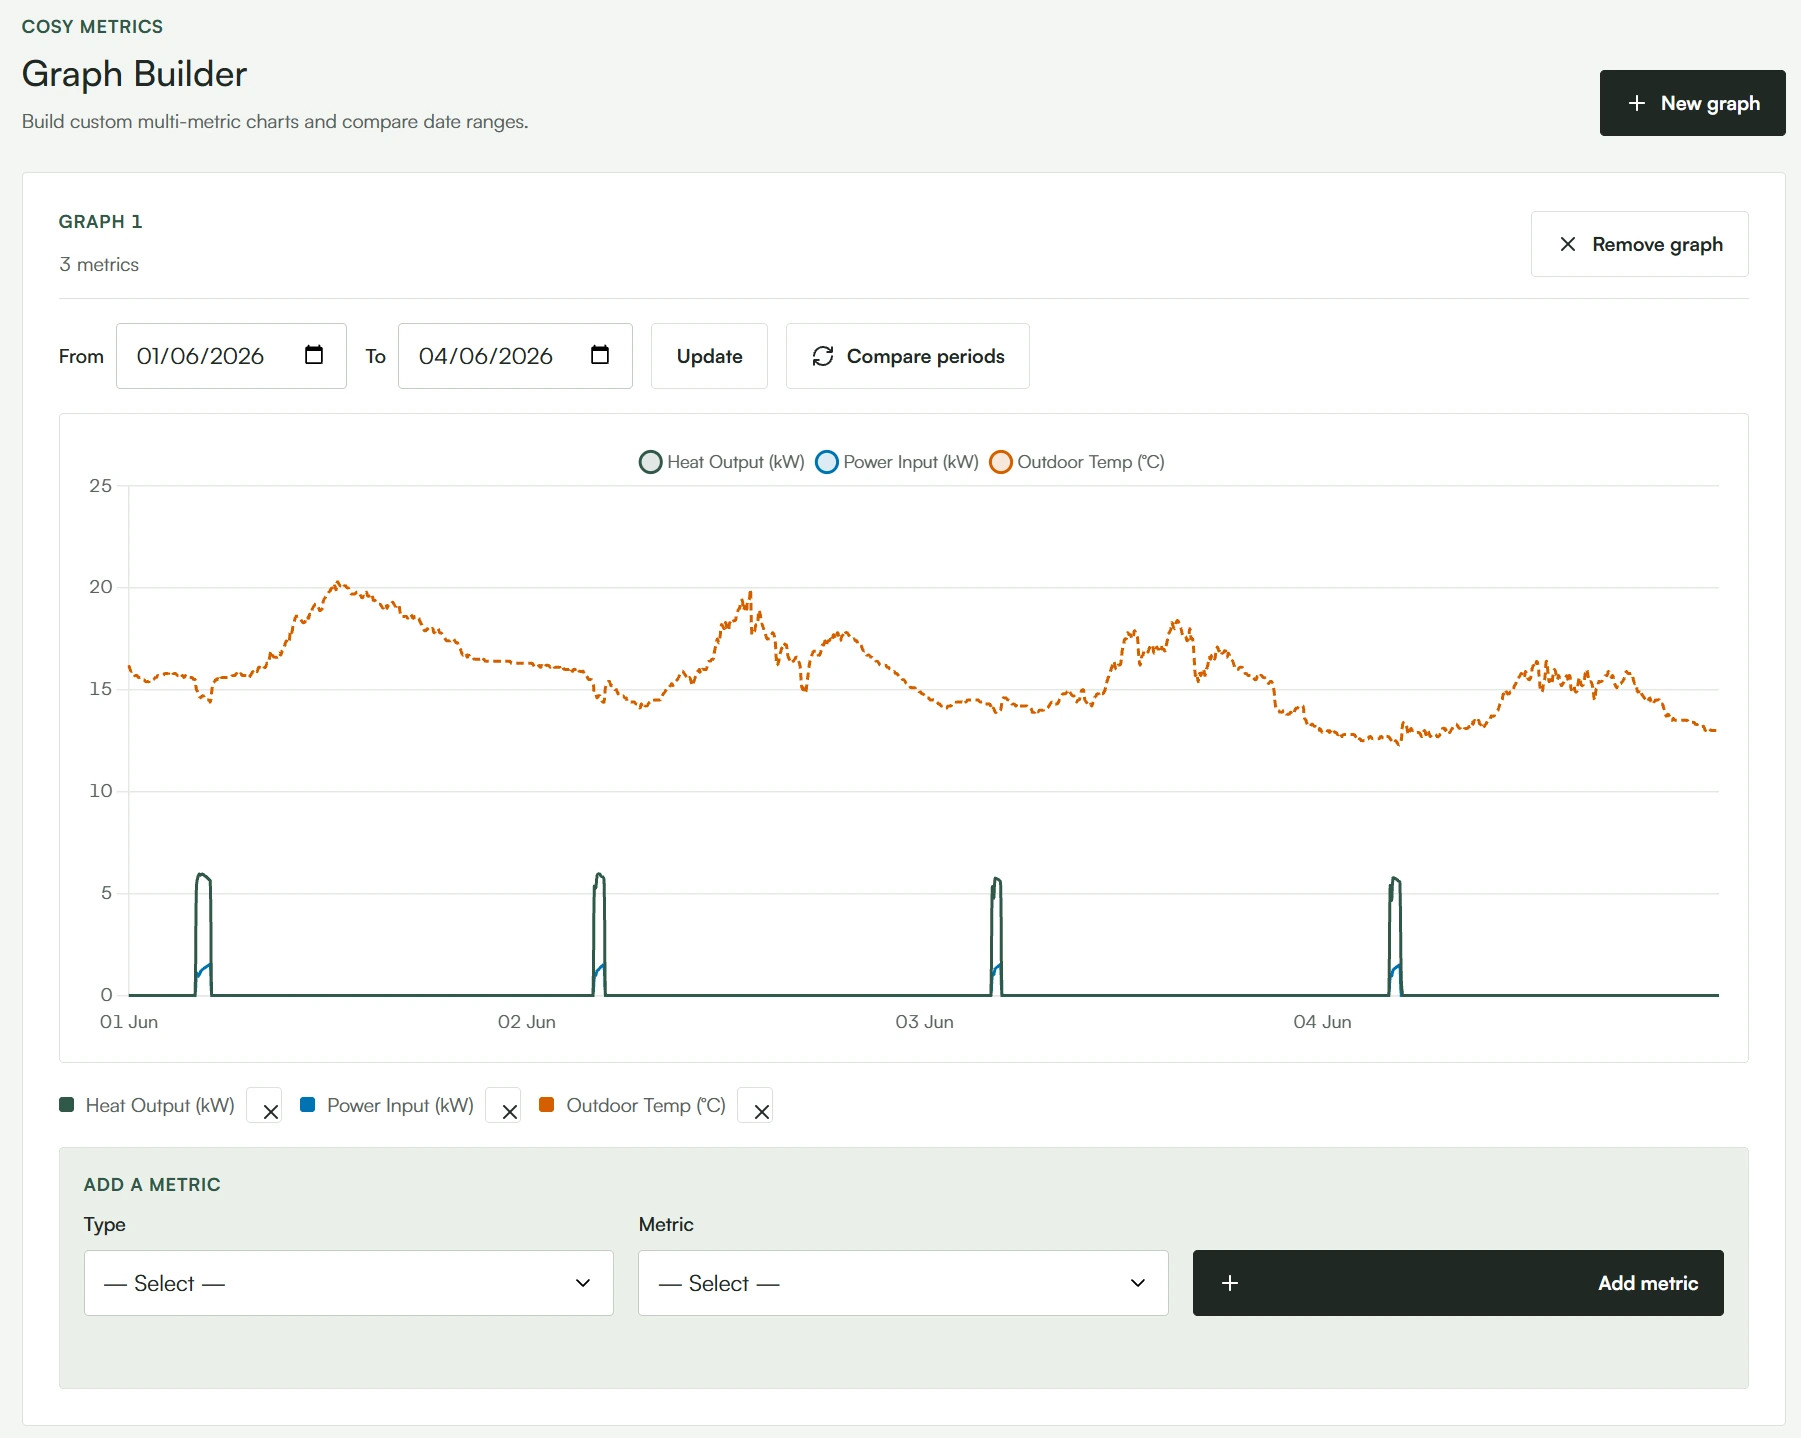
- Graph Builder
- Compare metrics in custom charts. Optional flow and return data is available when sensors are installed.
- Pod Sensors
- Temperature and humidity by sensor and zone, showing how rooms respond over time.
- Defrost
- Recorded defrost events, duration and frequency trends.
- Hush
- Compare performance when the heat pump's Hush Mode is active.
- Faults
- Active and resolved faults reported by the heat pump.
- Export
- Download CSV files to use in spreadsheets or other analysis tools.
Real dashboard examples
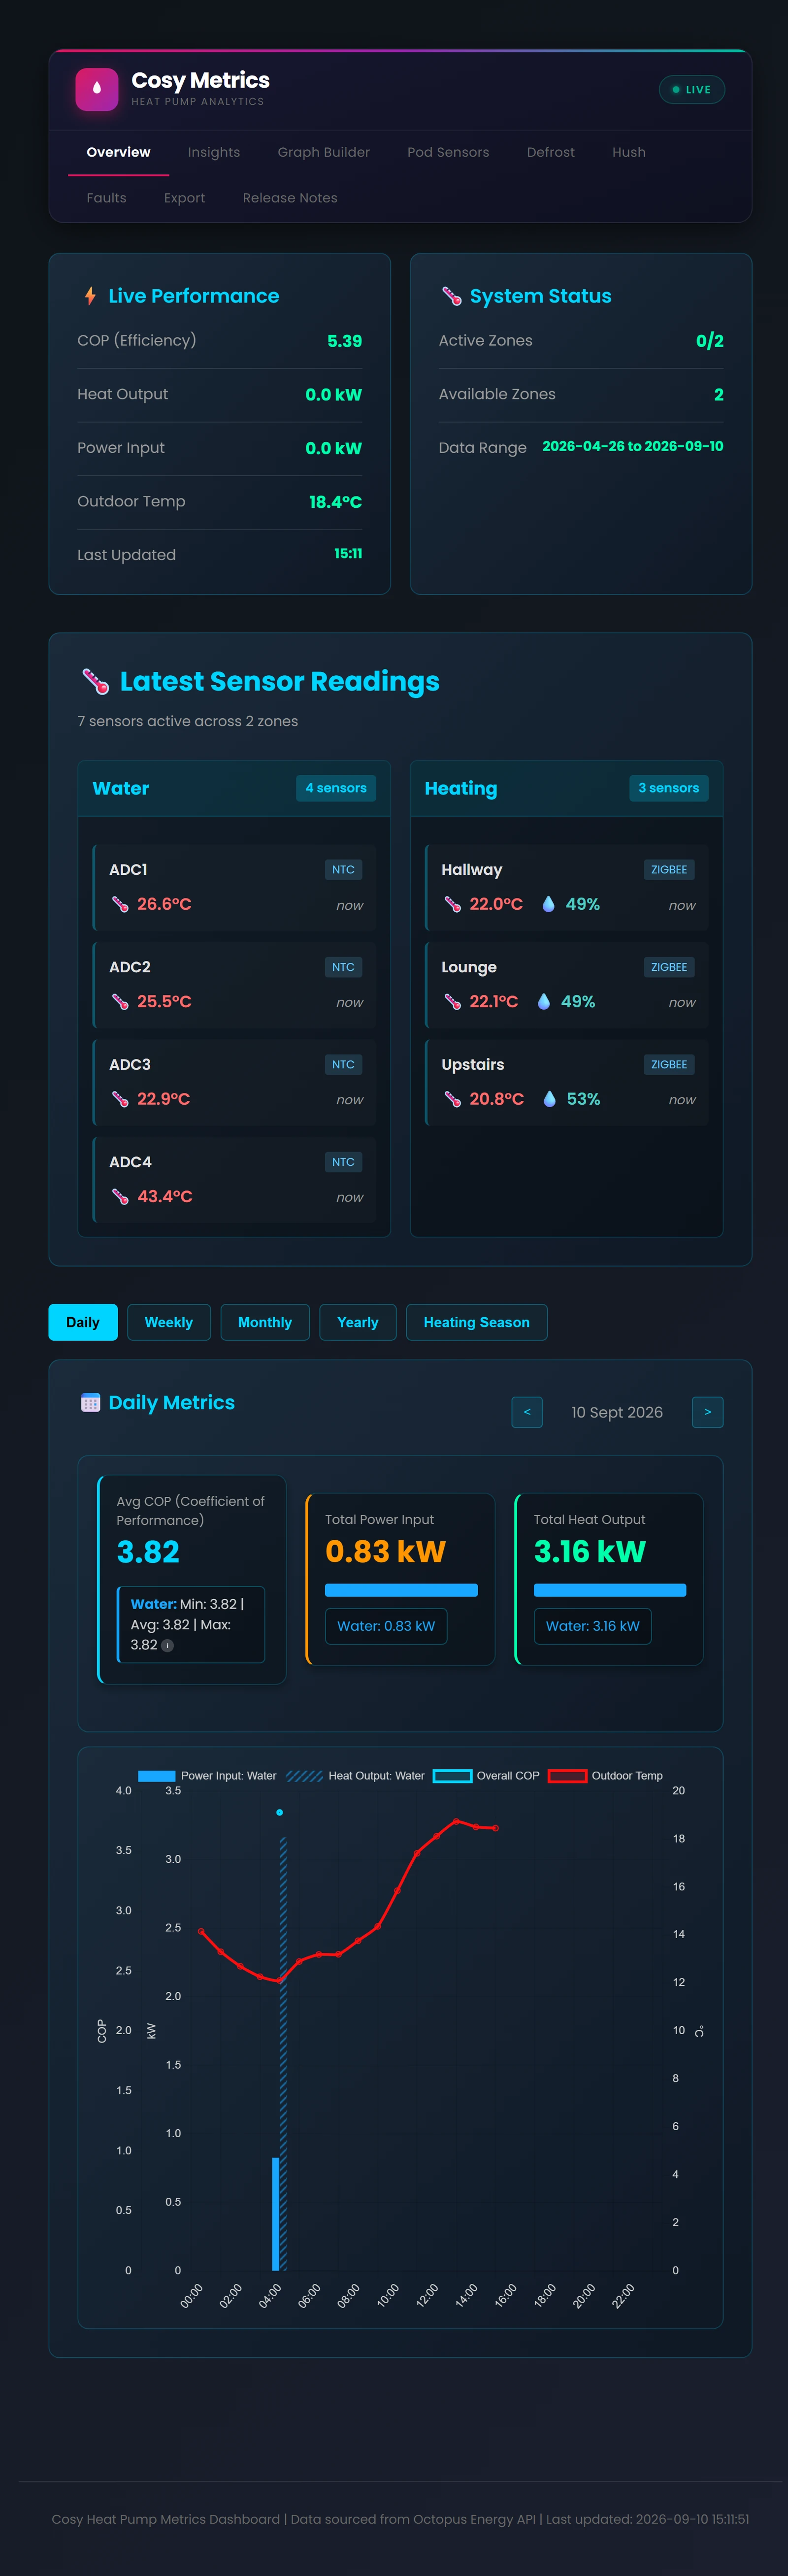
History and storage
History builds from when the display is first set up. Data is stored locally, with older readings progressively aggregated to manage storage. A phone can access the dashboard; a tablet or larger screen gives charts more space.
If it will not load
Check that both devices are on the same home network, that the display is powered on, and that the IP address has not changed. The dashboard itself loads locally; stale readings usually indicate a problem with the display's internet connection or the API.
Optional, not required for normal use
Flow & return sensors.
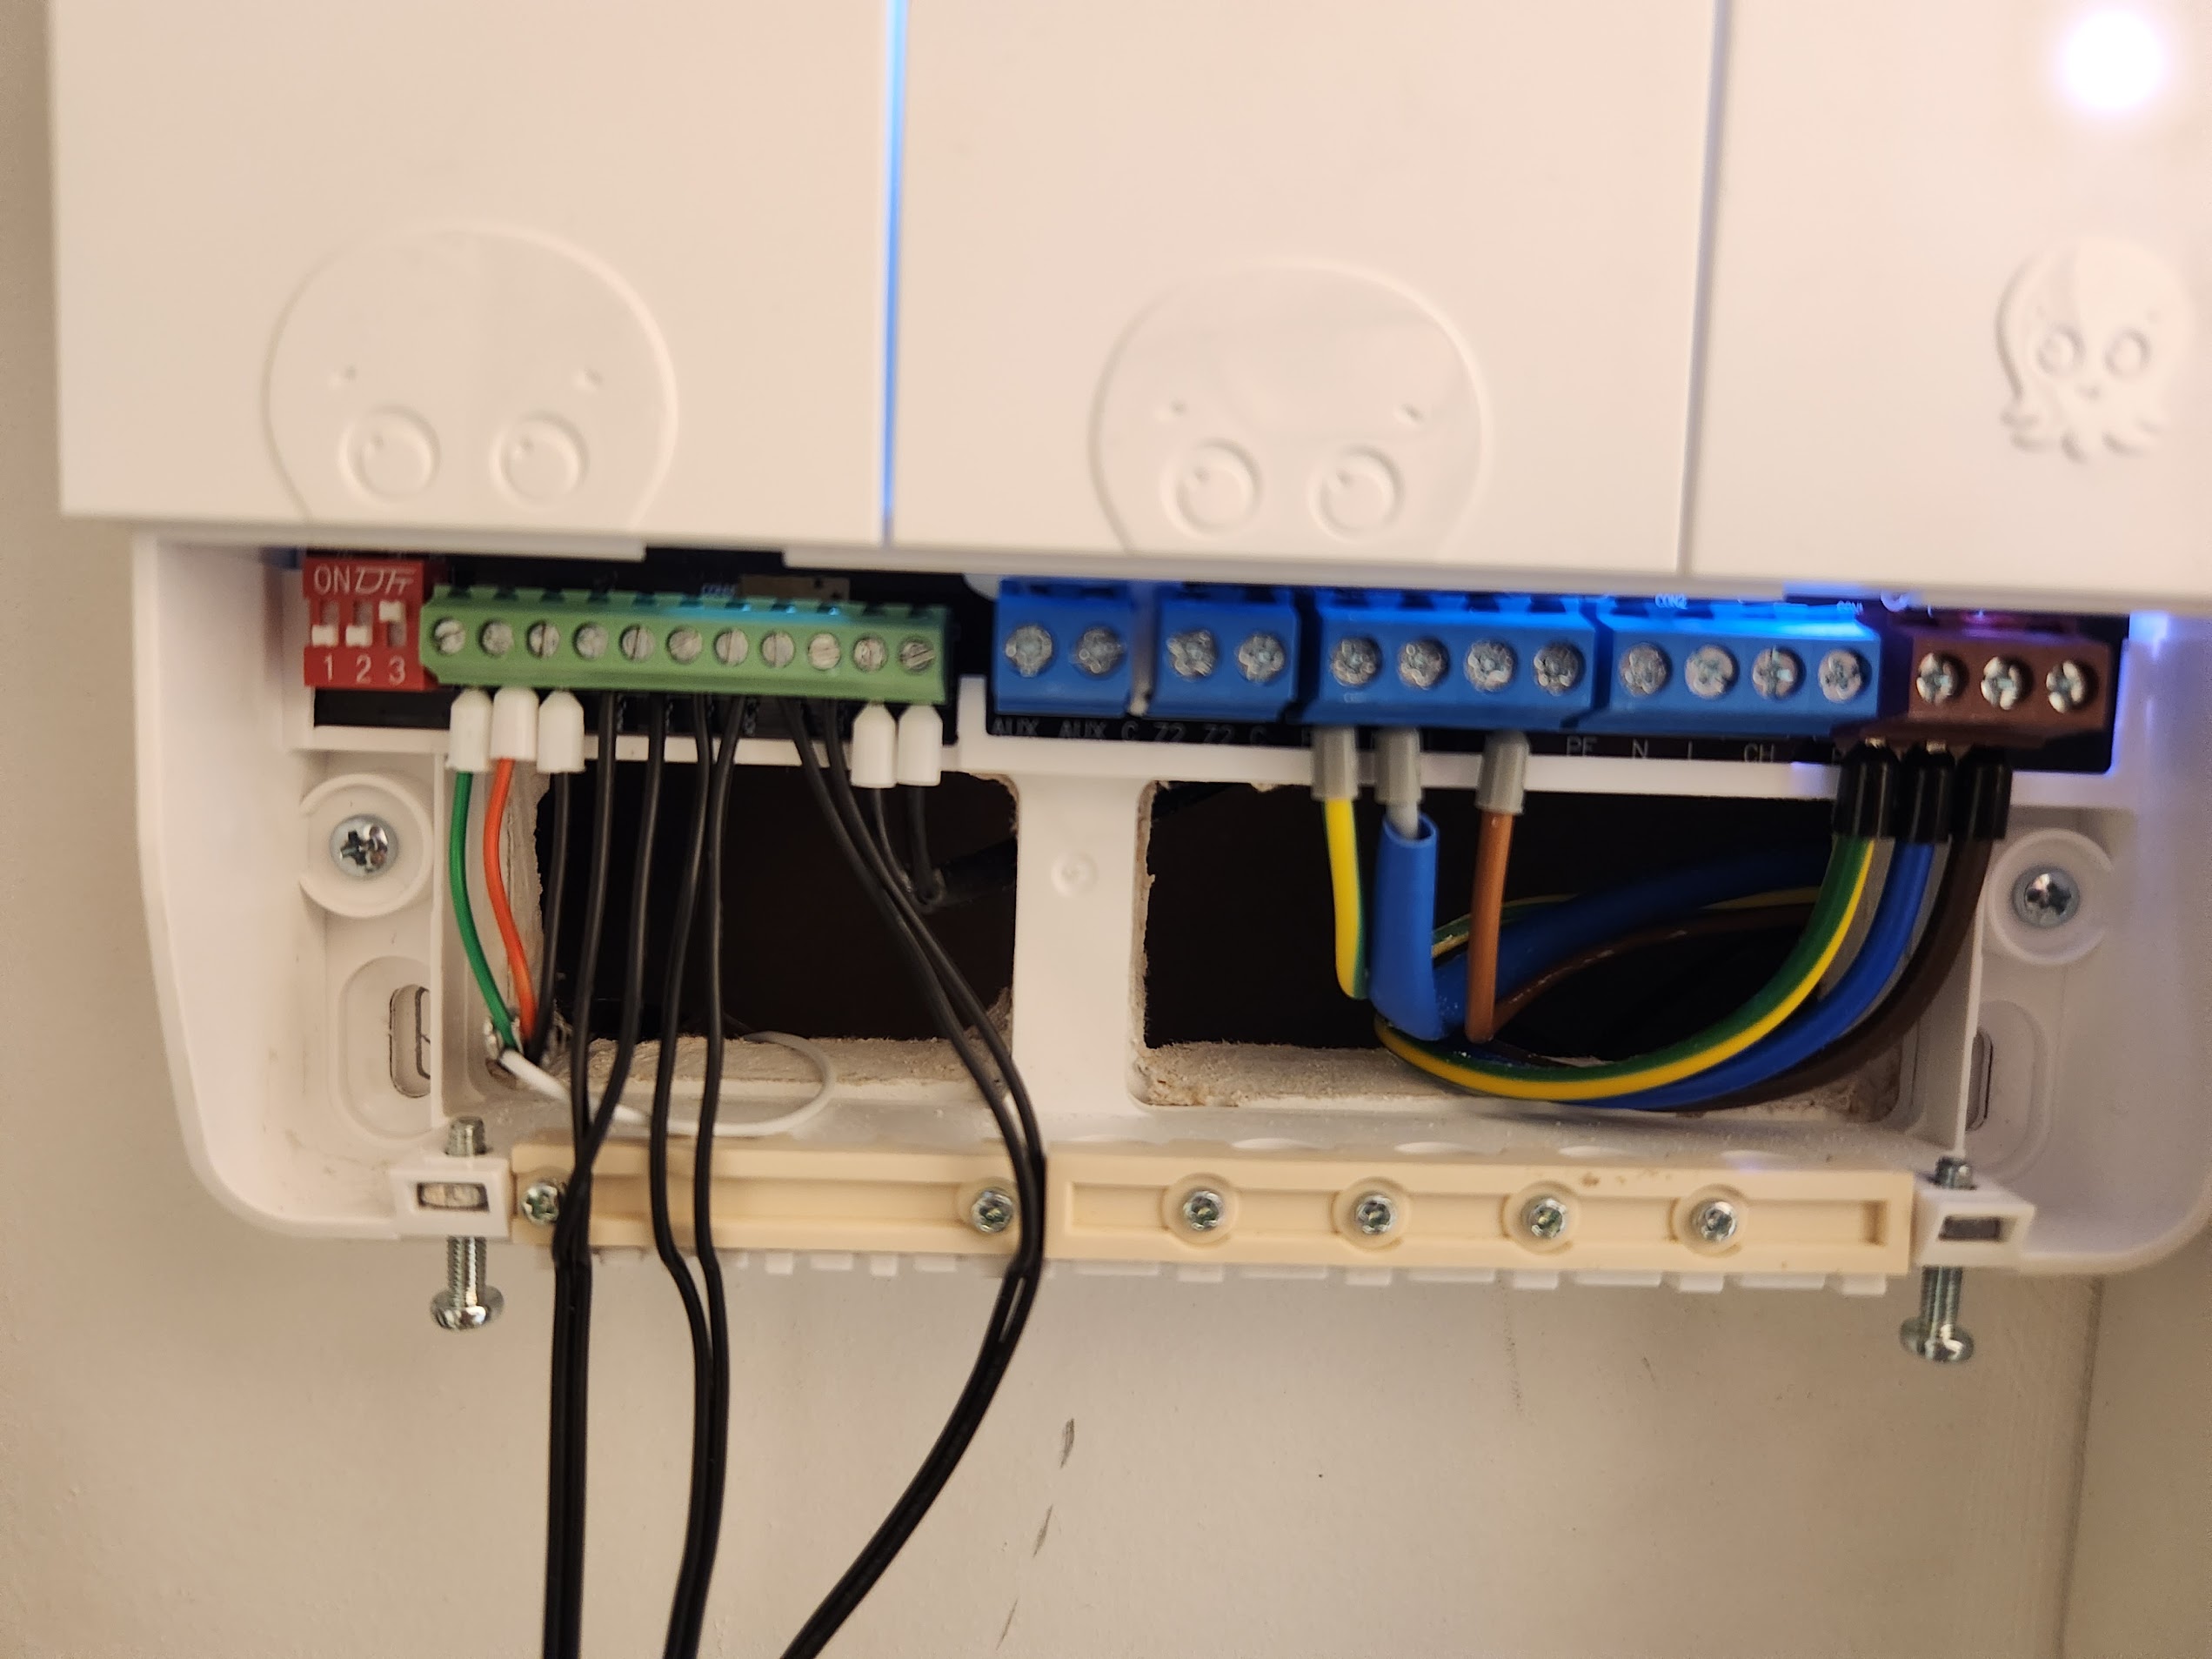
Additional sensors on the Cosy Hub can provide flow and return pipe temperatures, their difference and charted trends. These sensors and their installation are not included with the display.
Sensor used in the reference installation
An NTC 10K, 1%, B3950 waterproof stainless-steel thermistor probe, with a 1 m cable and 5 × 30 mm head. Confirm suitability with your installer and Cosy Hub documentation before purchasing or connecting sensors.
Installation notes for your installer
Probe ends may have a protective plastic cap that must be removed before connection. Good contact with the pipe and insulation over the probe improve the readings. Label flow and return probes so they can be identified in the setup.
Enable the readings
- Once sensors are installed and recognised by the Cosy Hub, open Preferences on the display.
- Enable Flow Readings.
- Assign a sensor to flow and a different one to return, then save.
The readings become available on the display's performance view and in Metrics Dashboard charts. If you do not have these sensors, keep Flow Readings switched off.
Need a hand?
Include your order reference and a description of the problem. Never send passwords or API keys.